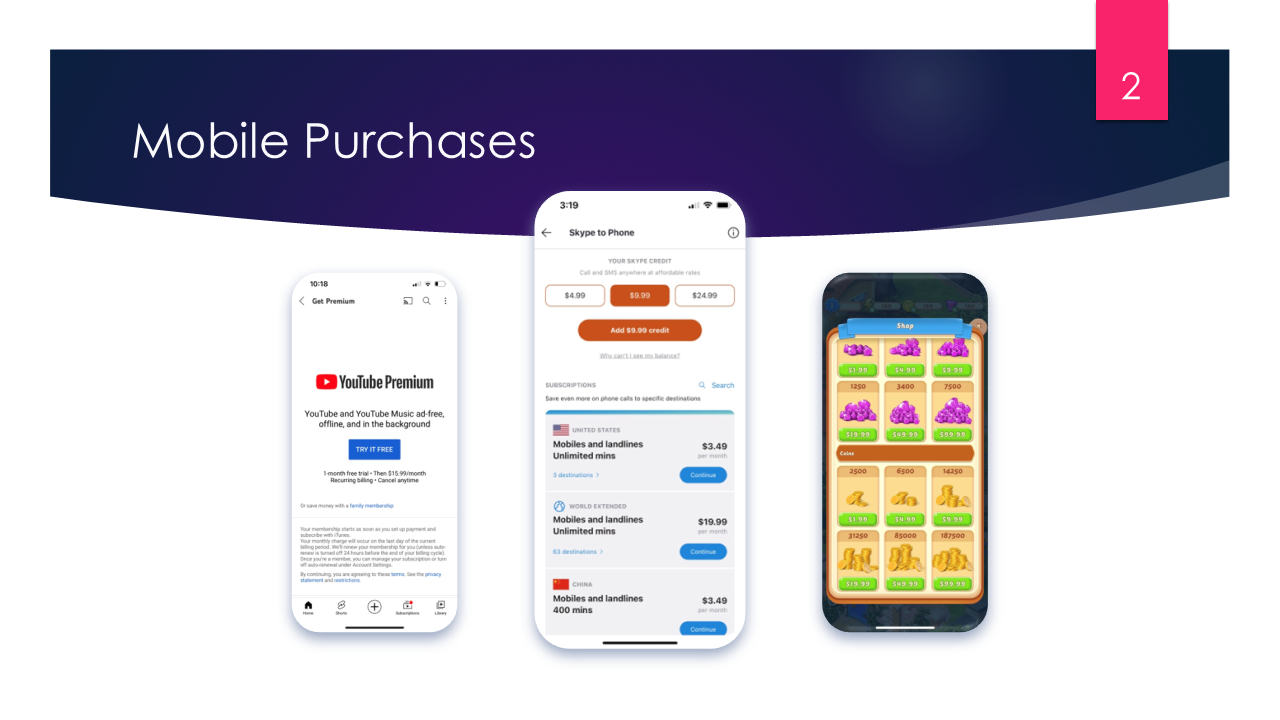
Almost everyone has bought something inside a mobile app – a YouTube Premium subscription, Spotify upgrade, or a pile of gold coins in some time-killing game. It’s so easy to spend money inside the apps. On the surface, it’s just one tap on a “Purchase” button, and you instantly get what you paid for.
But under the hood, that tap triggers a chain of events, data exchanges, and system processes you never see. This is where mobile in-app purchase analytics comes in – not just tracking money but understanding who buys, what they buy, how often, and why they sometimes stop.
Types of In-App Purchases
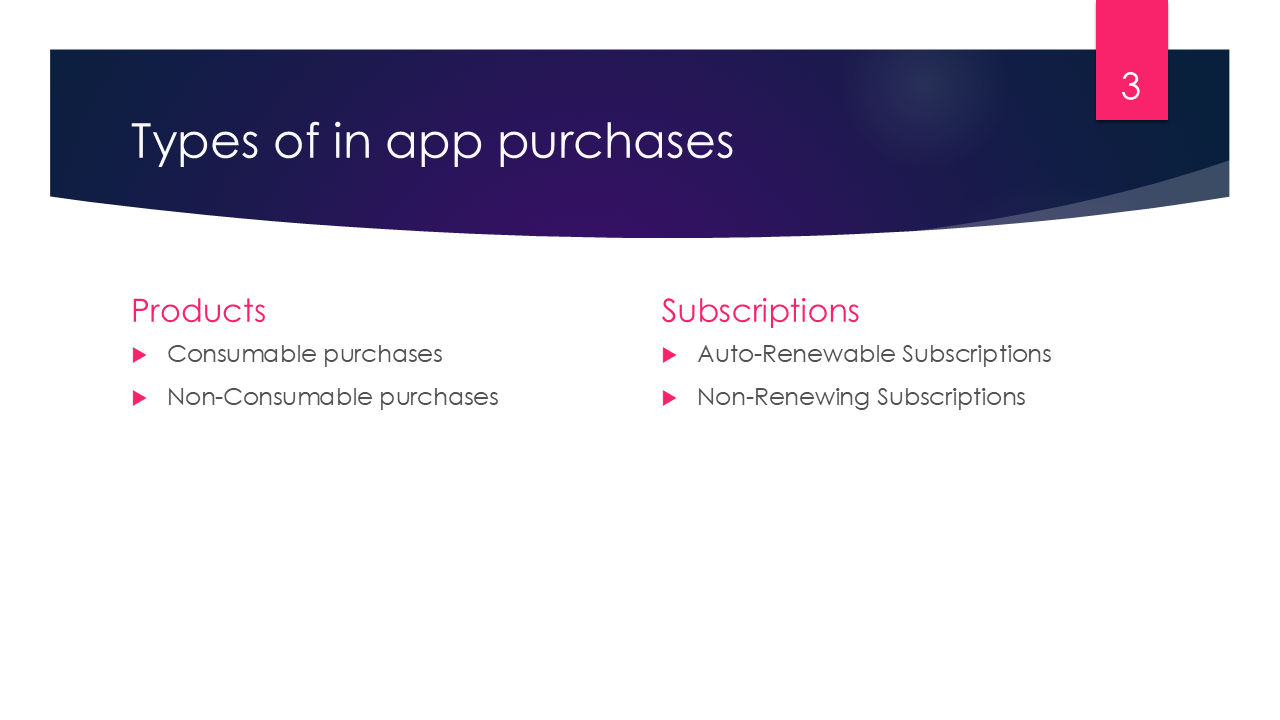
Both Apple and Google have a quite wide set of in app purchase types to cover needs of different developers. Unified with a term SKU (Stock Keeping Unit) they all can be divided into two large groups – Products and Subscriptions.
Products
One time products can be consumable and non-consumable.
Consumable – are the most common type of in-app purchases in mobile games. Most commonly, they refer to in-game currency, bonus health, or if we step away from games they can be power-ups in a dating app (like a super-like). Once the player buys and uses them, consumable items disappear. They can be repurchased at any time. Naturally, apps which use this technique give out small amounts of these items to keep user engaged.
Non-Consumable – Unlike consumables, once user buys non-consumable items, he has permanent access to them. In the industry jargon, they are also known as unlockable items. It may be unlocking secret level in a game, or premium functionality is a business app. This type of the product doesn’t expire or decrease with its use.
Subscriptions
Subscriptions refer to regular payments users make to access some kind of premium content. They unlock access to a set of benefits that users can get during a stated time period.
Auto-Renewable – Auto‑Renewable Subscriptions last a certain amount of time and automatically renew afterwards. An auto-renewing base plan provides uninterrupted subscription entitlement until canceled. Subscriptions can be canceled by the user, by the developer, or by the billing system. Once subscription is cancelled, it will stop renewing.
This may be some payment plan or an extra space in a cloud storage. When setting them up, the developer can select how long he wants the subscription cycle to be – anything from 1 week to a year.
Non-Renewing – With Non‑Renewing Subscriptions users are able to access premium content for a limited amount of time. After that period ends, the users still can renew their subscription. However, unlike with auto-renewables, they have to do it manually.
It may seem that it’s useless as app needs to remind user about the expiration date and make him do extra decision whether subscribe or not. However this type of subscriptions may be helpful if the app doesn’t provide a benefit for long term access or instant access, like providing seasonal information, when maintaining the subscription is only applicable to the user for a period of a month or so.
Evolving Subscription Structures
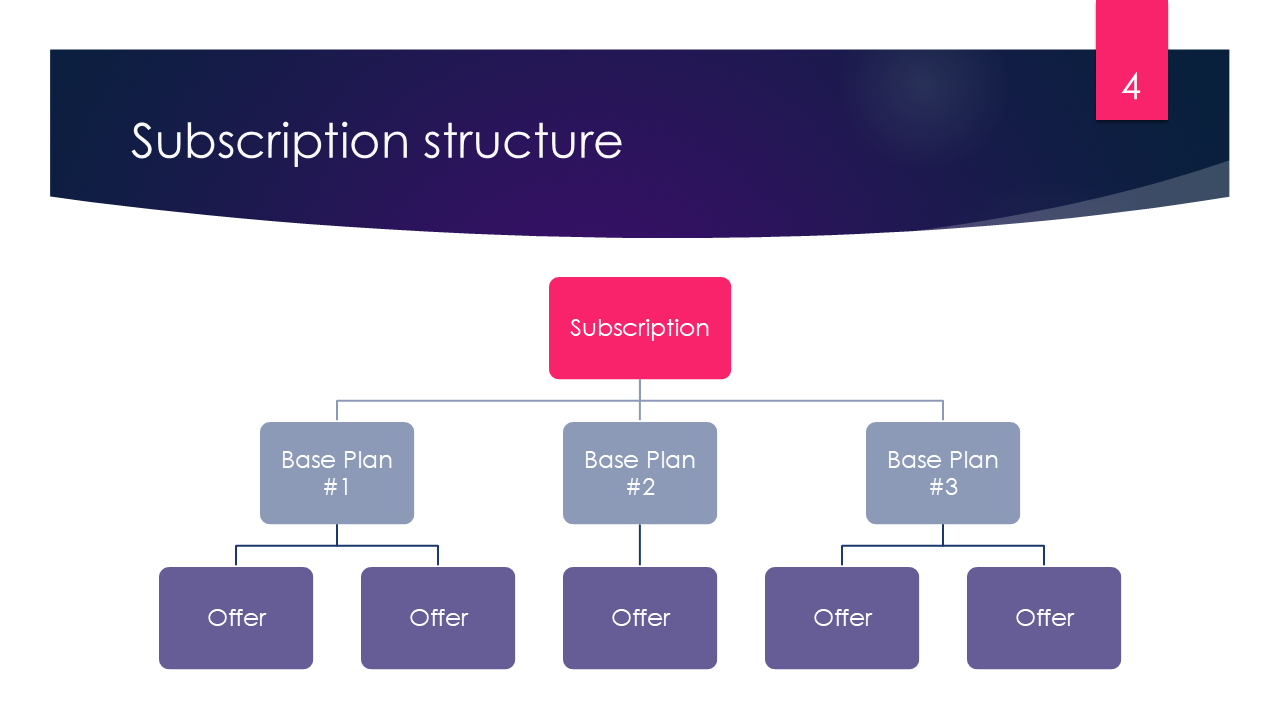
Until mid-2022, subscription logic was similar on both platforms. Then Google introduced a hierarchical structure, which basically converts Android subscription to a hierarchy. Now Android subscriptions may consist of one or more base plans: each subscription can have multiple base plans, each with its own billing period and renewal type. Auto-renewing plans can include offers – targeted discounts for eligible users. This flexibility lets developers fine-tune pricing and retention strategies.
Receipts: The Digital Proof of Every Transaction
And when user makes a purchase, disregarding its type, both Apple and Google send developer a special set of data. Exactly like in the supermarket, every money transaction is confirmed with so called receipt.
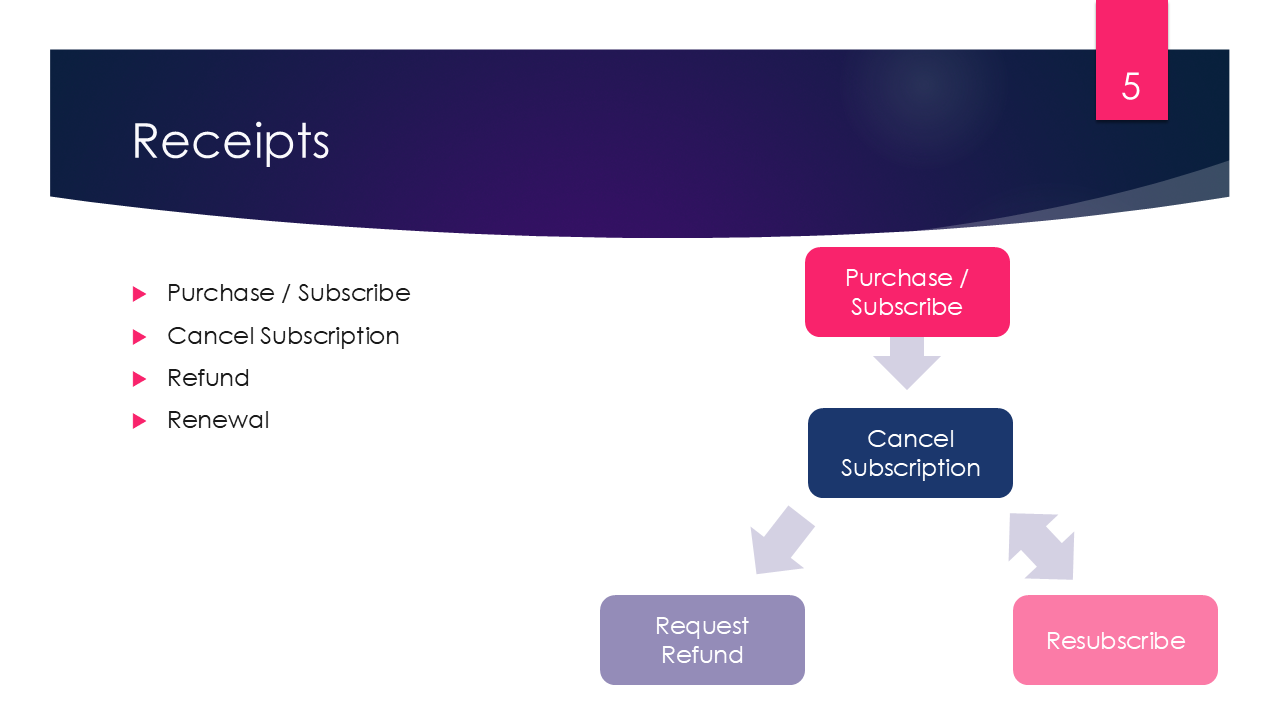
To be accurate receipt is generated not only for purchase but for any event related to money transaction: Purchase / Subscription, Cancel Subscription, Refund, Renewal.
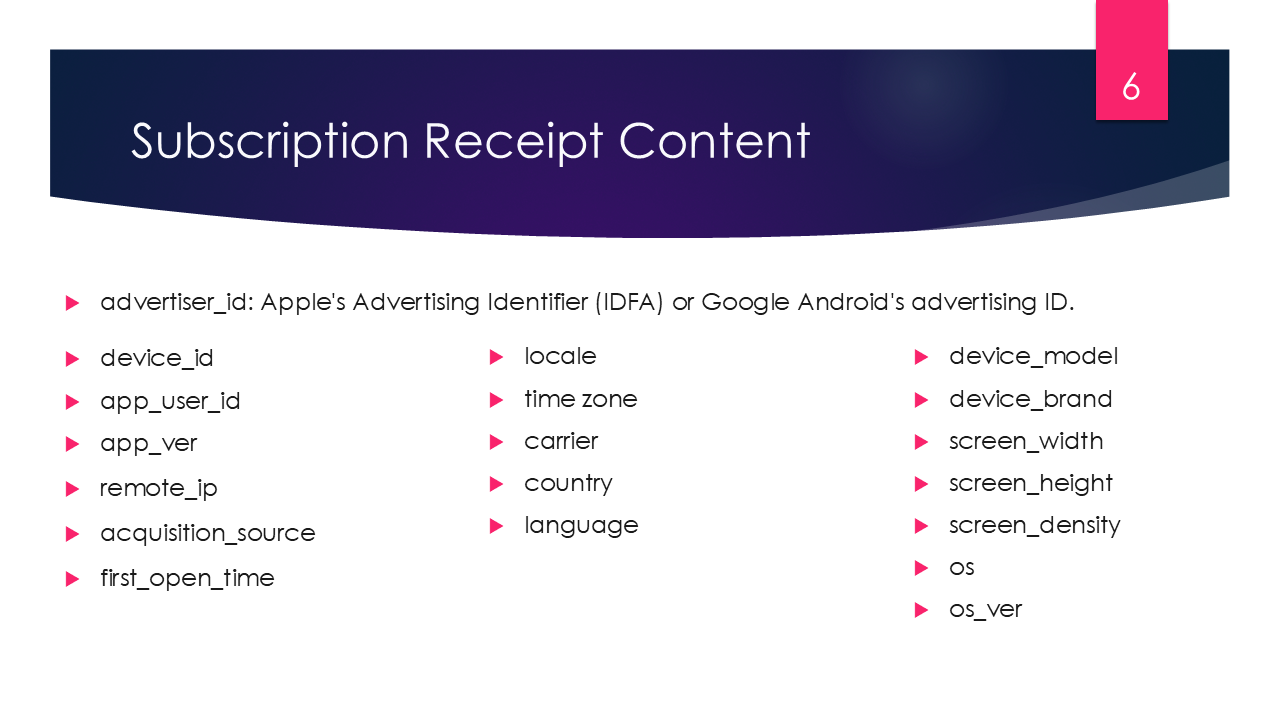
Receipt contains not only amount paid but also some information about the buyer and his device, for example some unique IDs which help to identify user and see his journey to this subscription – which ads he saw, from what source this user arrived.
This data can be retrieved without any extra tools.
Extending the Data
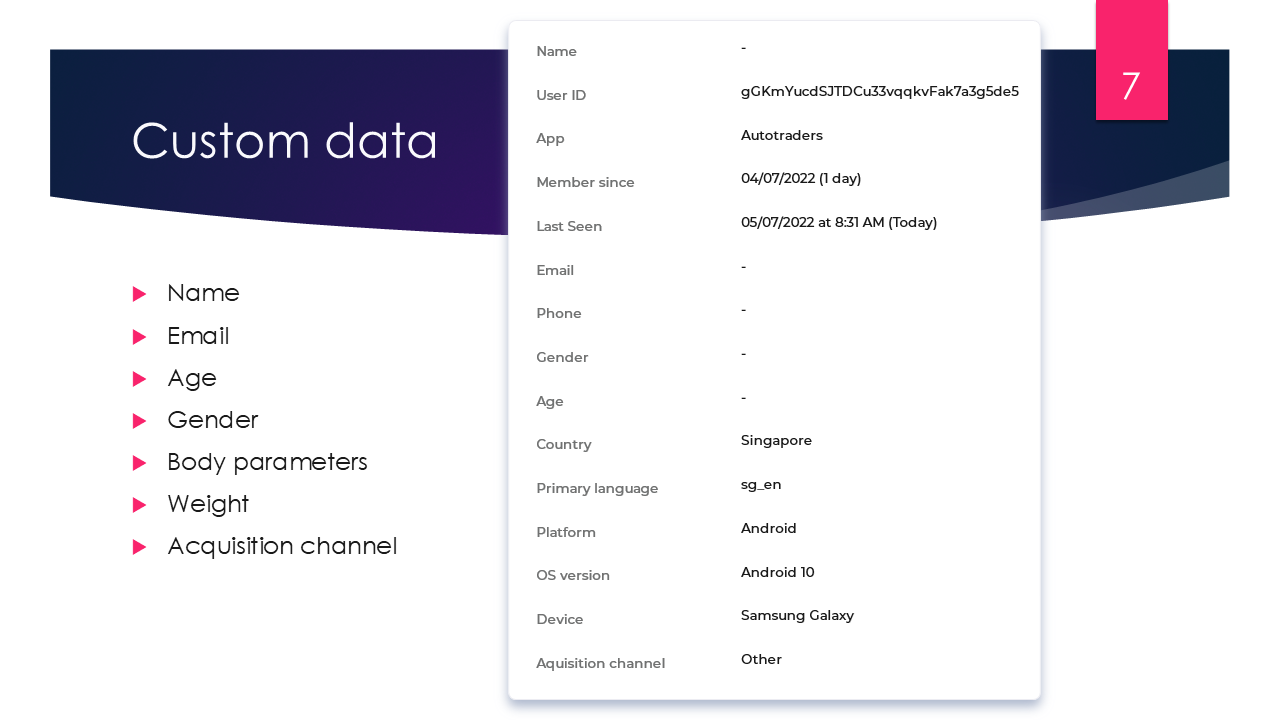
But if the developer wants more, he can manually extend this list and push inside a receipt any information, that his app gathers about user, like email, or age, or gender or even for example weight, if it’s a weight-loss app or a fitness tracker.
More than that developer can register and track own events: when user opened media file, reached some pages, clicked here or there. Also developer can gather third party information like aquisition channels, through which user landed on app installation page.
Defining the Target Audience
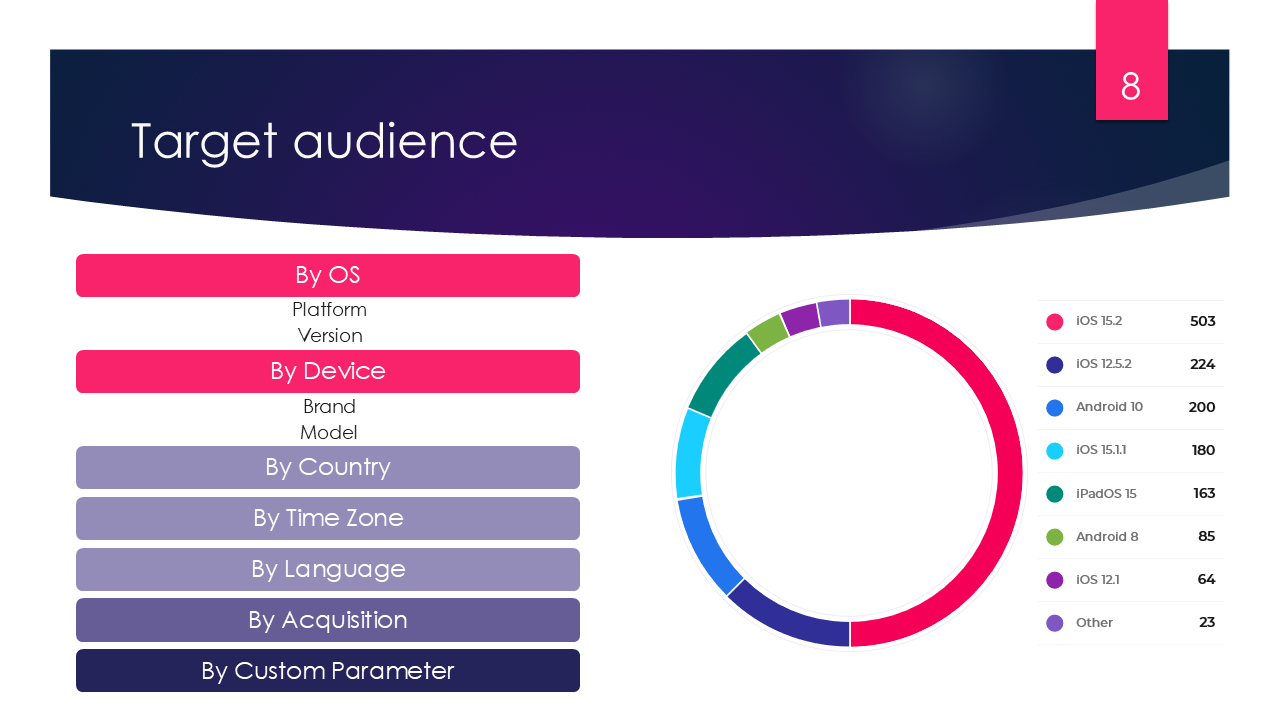
Before starting selling something it’s good to analyze who may need it and who will use it. So called target audience, the specific group of users who most likely will want this product or subscription in ideal circumstances is determined before launch, and even before the development. But it’s never late to do more analysis. Even if user didn’t share with the developer personal info, using anonymized data from receipts it’s possible to determine groups for each type of subscription.
Receipt data can reveal patterns by OS, device brand, model, country, time zone, and acquisition source.
Knowing target audience and most active users may help sharpen marketing strategies to engage more users like these.
Personas: Humanizing the Data
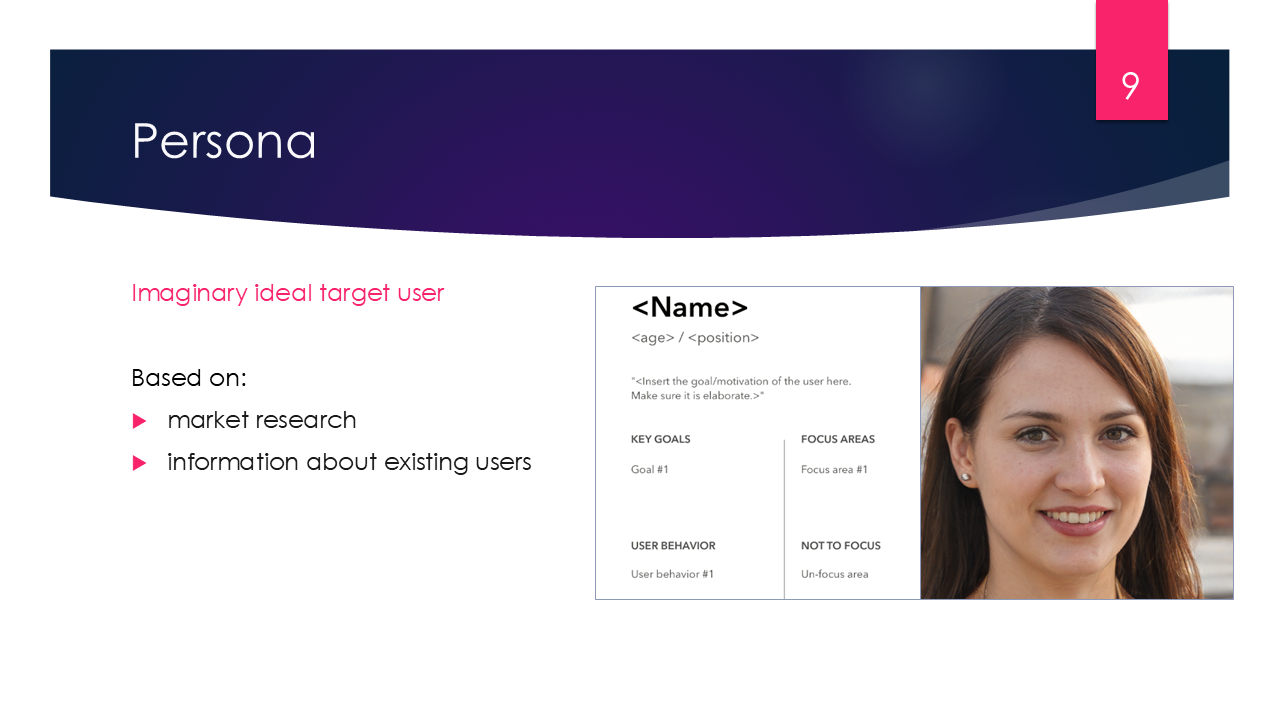
There is a nice technique in mobile marketing called creating personas. In general a persona is a user type, which has some common characteristics and behavior and is ideal target market for a particular app. It’s an imaginary person, who will be using this app, and the whole story is built to engage and keep this person. Personas should be clearly defined but are not the same as user segmentation, which can be sophisticated and highly detailed.
In practice, user personas help to humanise mobile marketing campaigns and minimise advertising cost by more precise targeting. Some marketologists even give these personas names, pick photos, think out biographies and constantly check if current strategy, design, features fit this imaginary user.
Revenue: The Core Metric
Knowing user is extremely important but of course gaining bigger userbase is not the primary aim. The most crucial thing that interests app owner is does the app bring any profit.
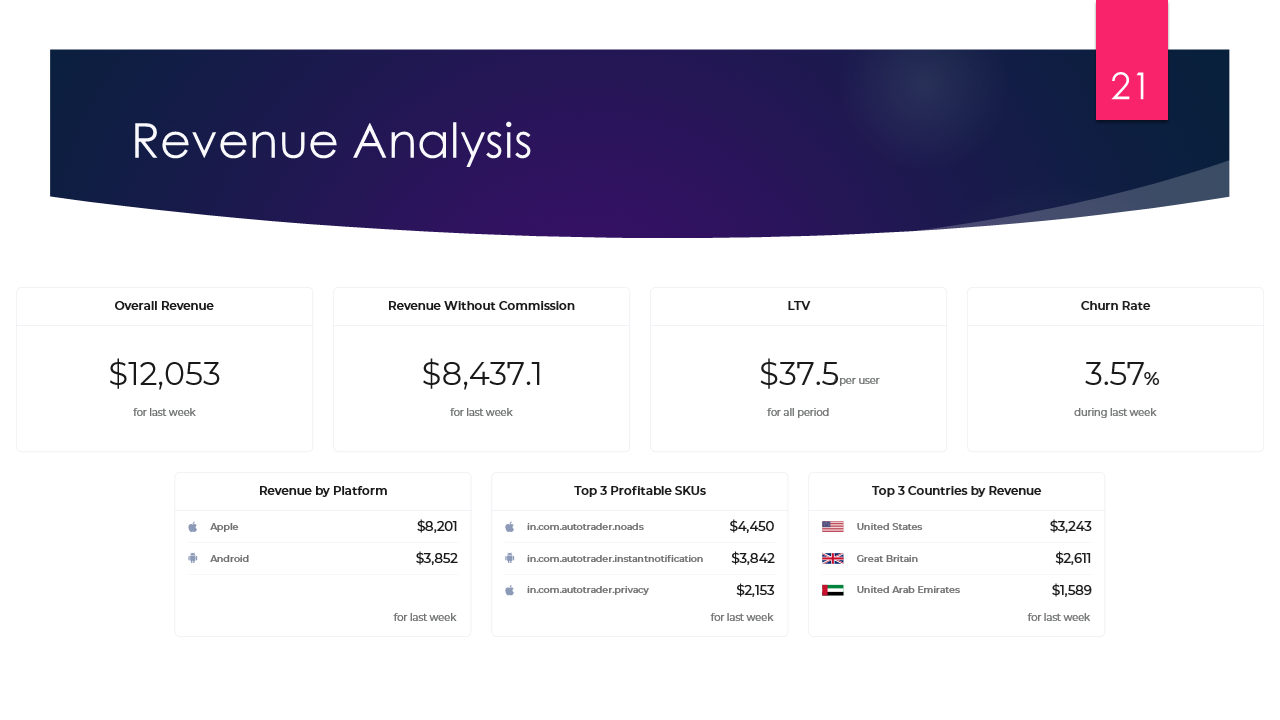
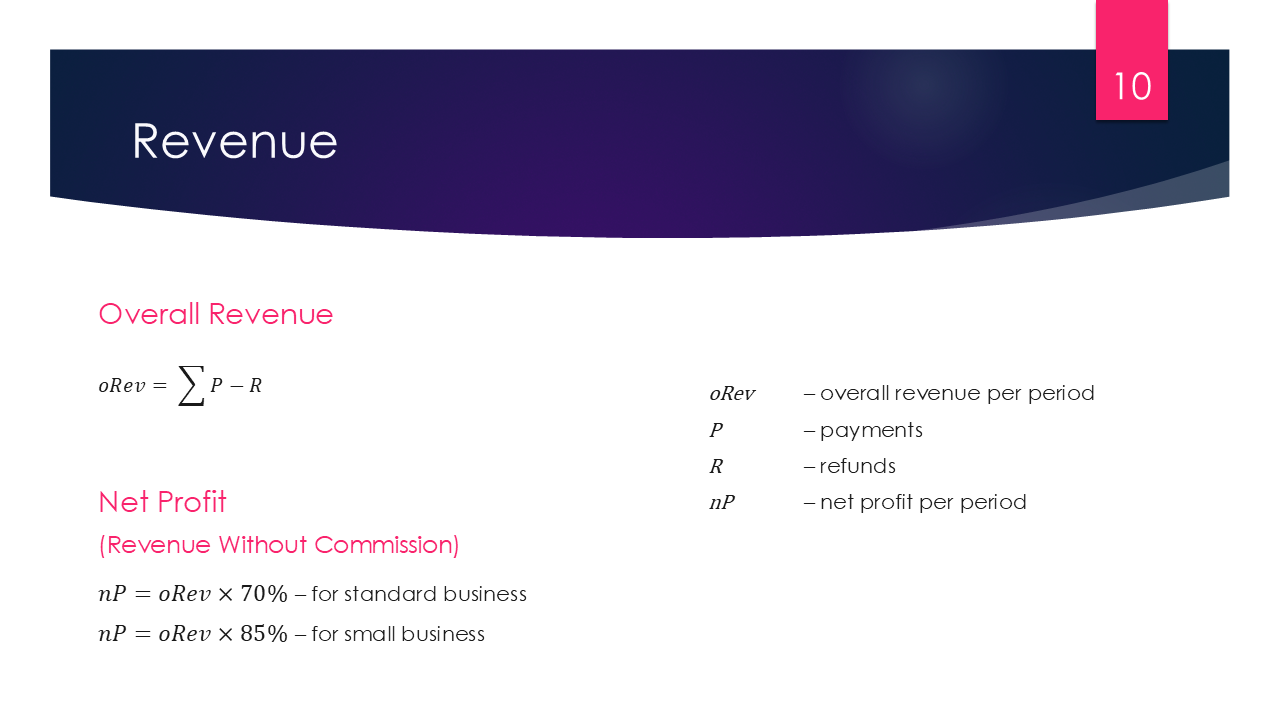
First and most tracked parameter is revenue. Revenue parameters are calculated for a particular time period – for example a week, month or year.
Overall Revenue
Overall Revenue per period is the sum of all payments made by users during this period excluding refunds requested during this period.
Mobile distribution platforms like App Store and Play Market aren’t charity, they also make profit on apps and SKUs being sold. Standard market commission is 30%.
At the end of 2020 Apple rolled out a special program for small businesses, and Google did the came in July 2021. If app qualifies as small business, it can get discounted commission in 15%. As long as app owner has received less than 1 million USD during a 12-month period, the commission is 15%. Once he goes beyond the 1 million mark, the commission increases to 30%.
Double work for analysists, because none of the platforms reveal information which program is used by each business. So here is how we can calculate net profit.
Of course analysist can also calculate Revenue by Platform, by Country or by SKU just applying filters to data. Also good idea is to monitor most profitable SKUs.
Built-In Analytics Tools
Apple
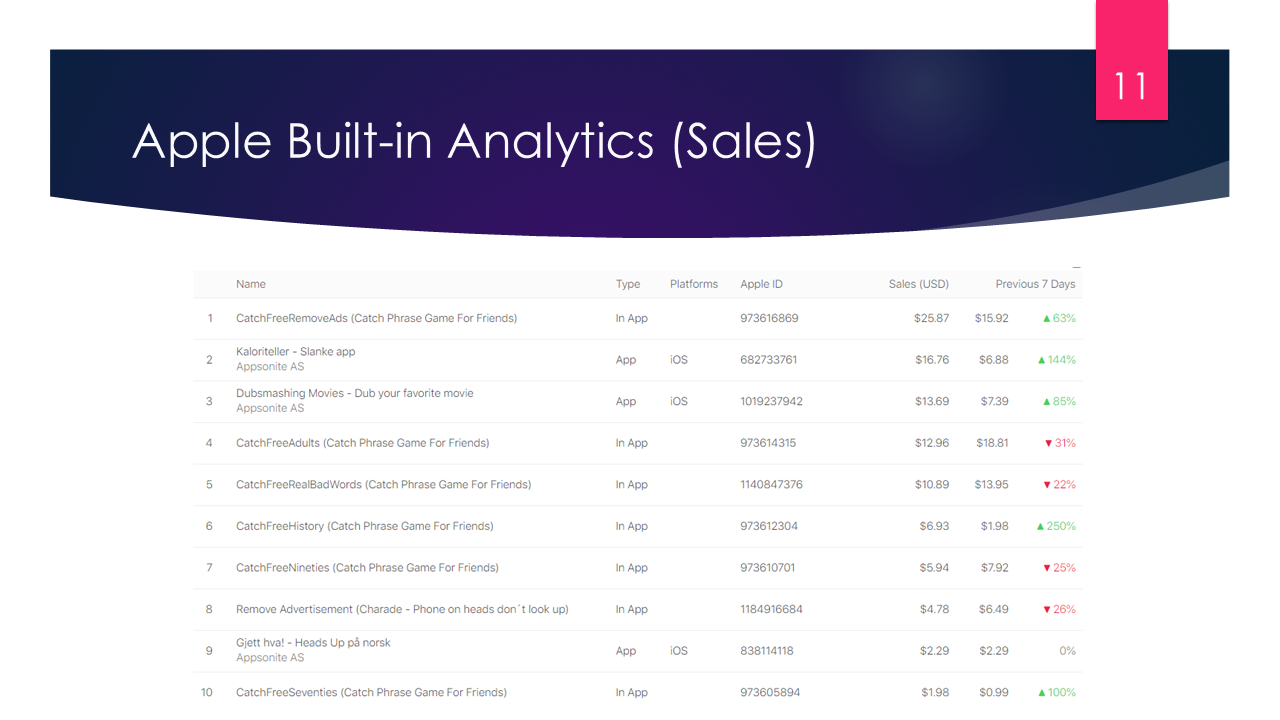
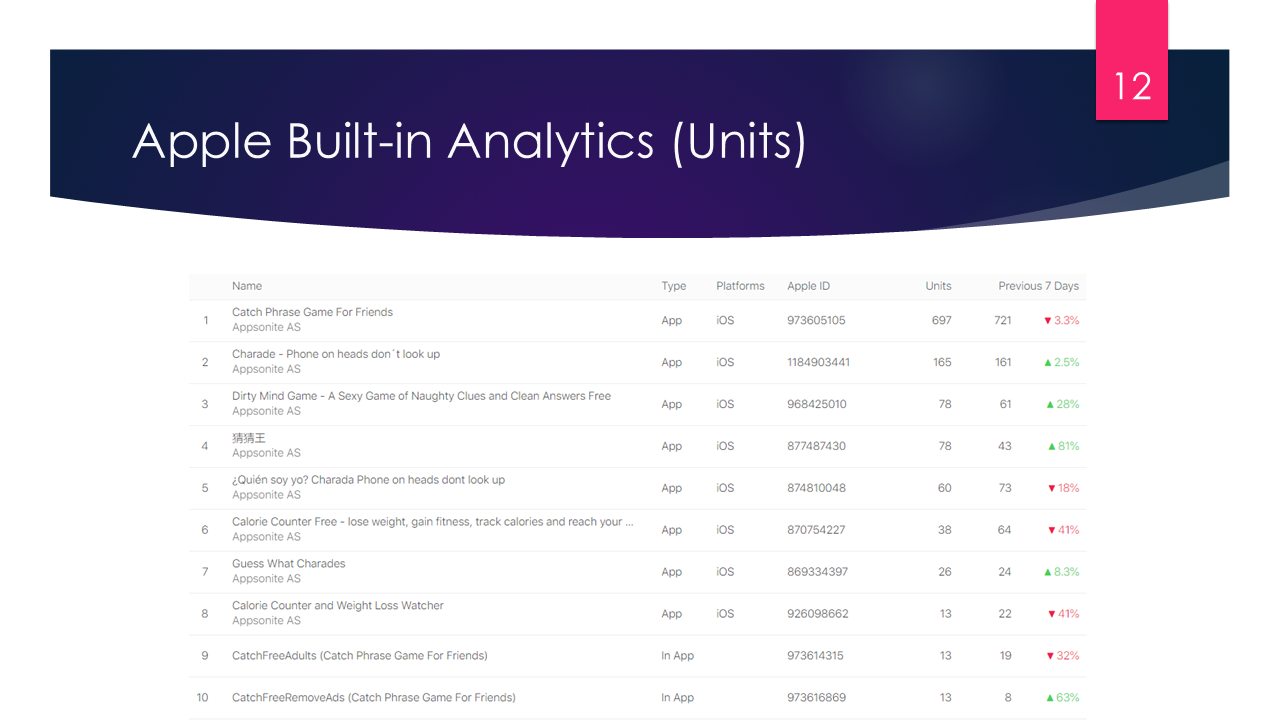
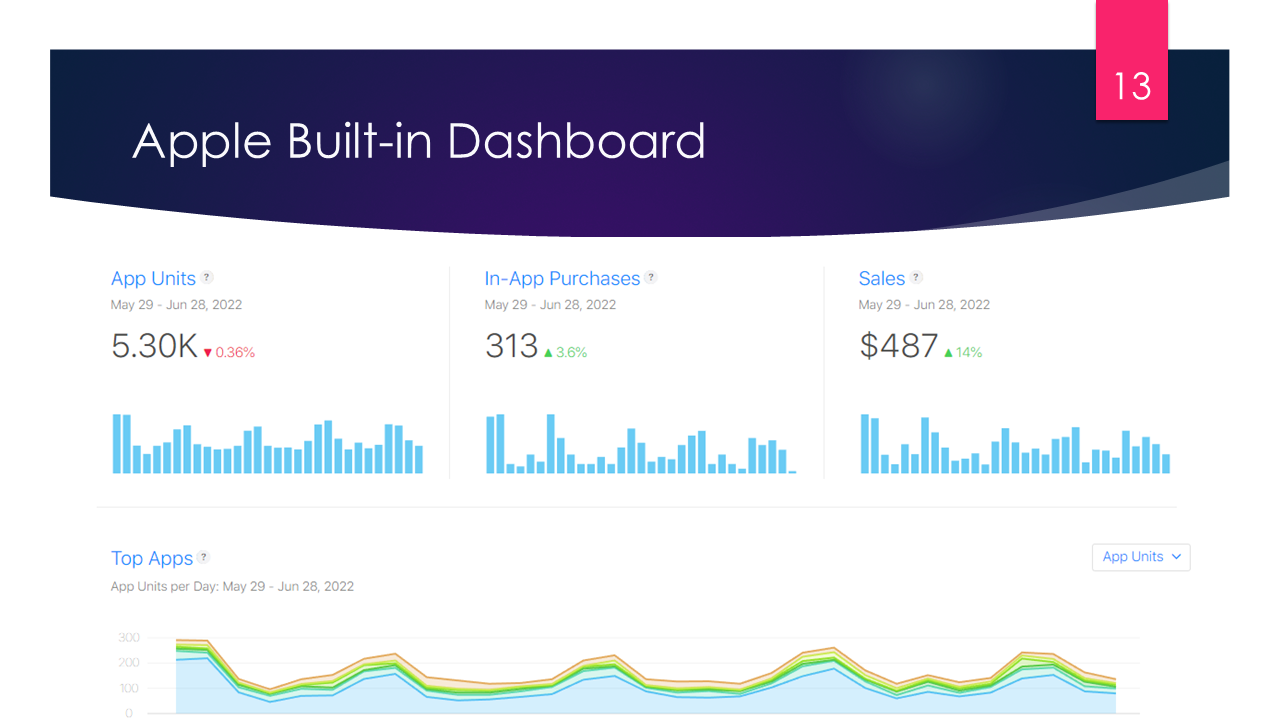
Apple has a built-it Analytics tool which may be a good start for an app owner who wants to start monitoring purchases and user behavior.
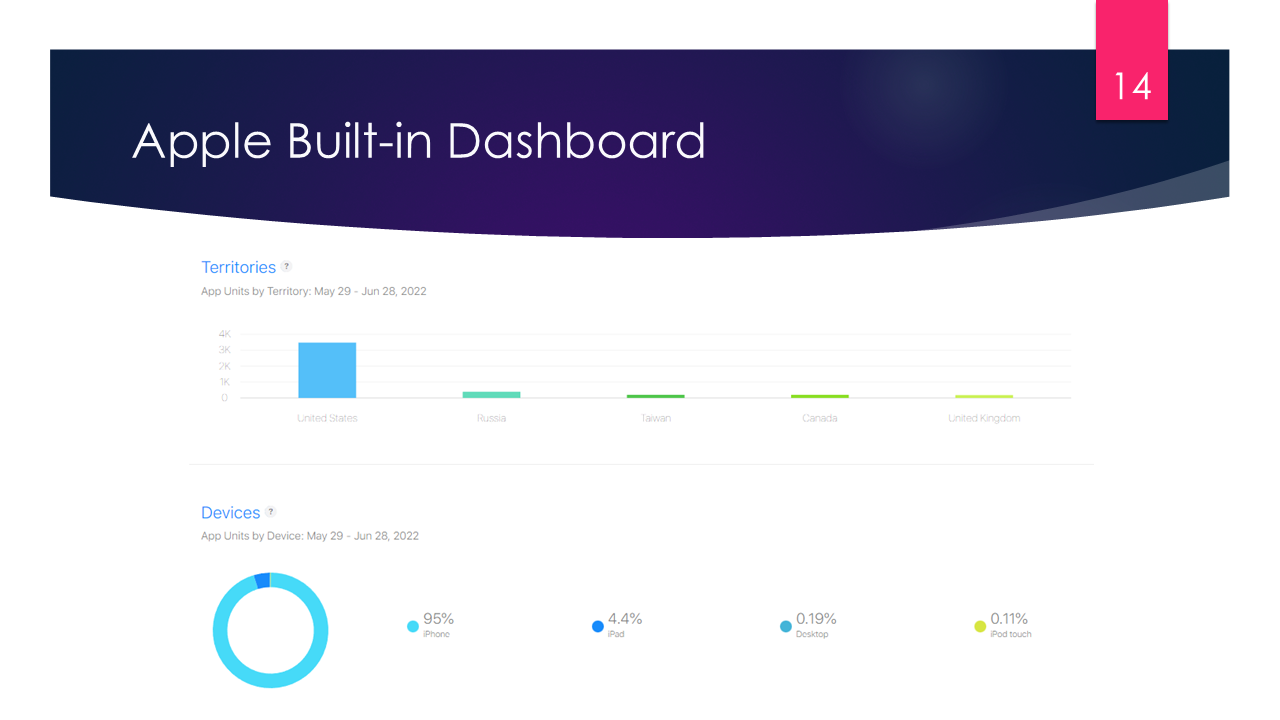
Incomes can be analyzed by pre-selected period by each SKU which includes apps, in-app products and subscriptions. It provides some filters by device (iPhone or iPad), or by category (game or app) or by territory (like the USA, Europe or Africa and Middle East).
User may analyze incomes either by revenue or by sold units / active subscriptions. And it even has comparison rates in percent with the previous period, like if you’re analyzing a week, it will show how this item sales changed since past week and so on.
Nice clear dashboards showing basic account performance numbers and charts, may be good for app owner but not enough for data scientist who wants to squeeze all possible from the data.
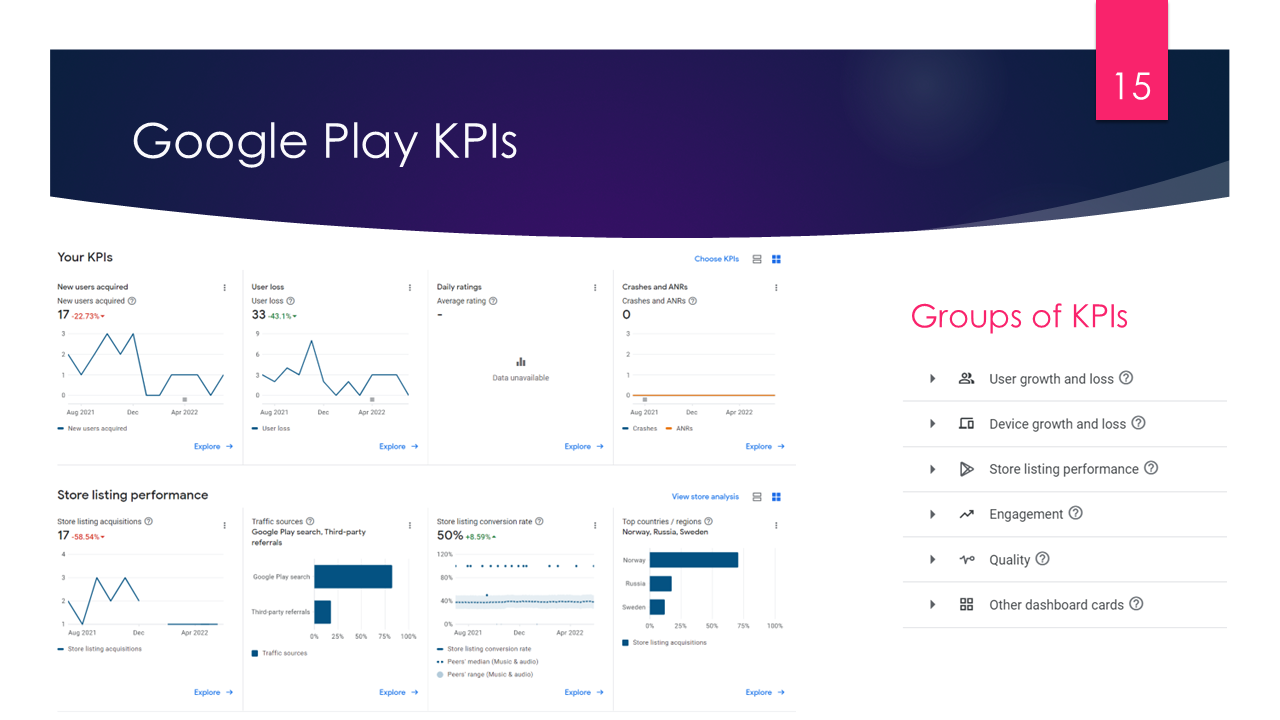
Google is unfortunately much more humble and much more geeky – no nice charts, no clear data representation, for the account in general, only for a single app, where you may select and view particular KPIs (Key Performance Indicators).
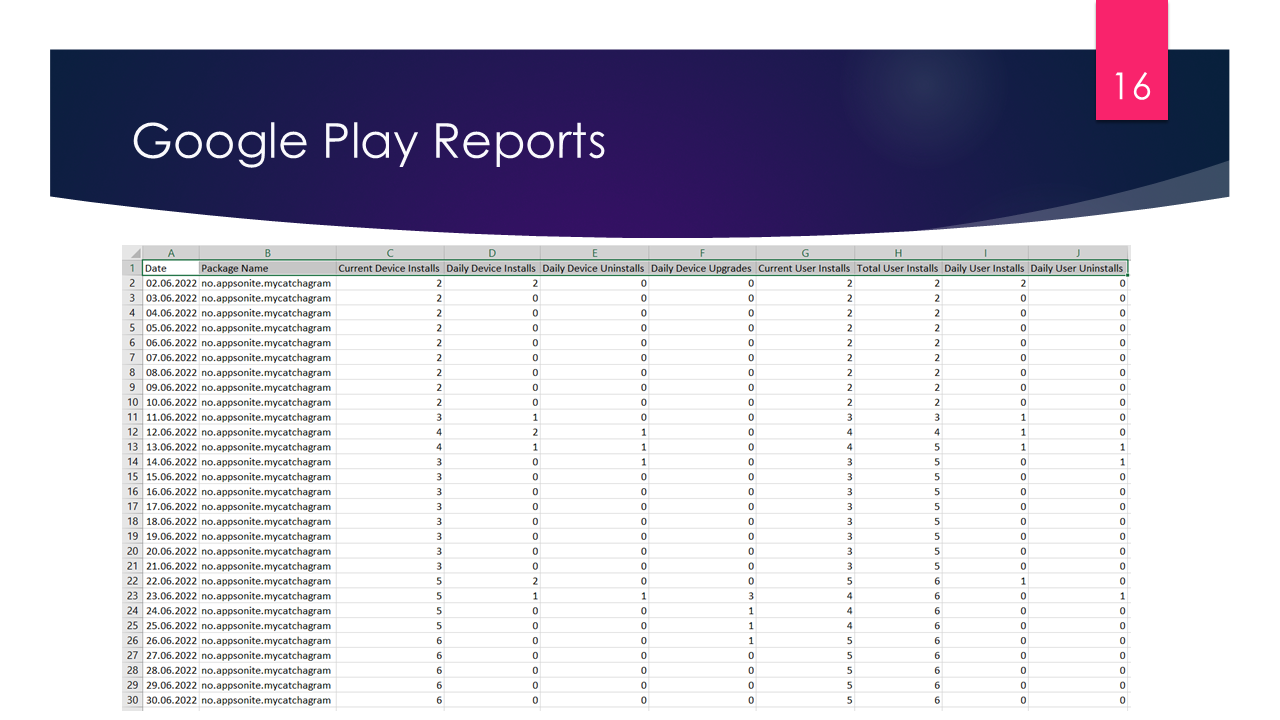
For the whole account stats about in-app purchases, Installs , Downloads etc can be downloaded as CSV-reports each in separate file and analyzed manually. Analyzing Android with built-in tools may look like a hardcore for Excel geeks.
Beyond Dashboards: Calculated Metrics
The dashboards shown above miss, let’s say, derivative parameters which lay on a deeper level and should be calculated using data we discussed above.
To get actionable insights, you need derived KPIs like:
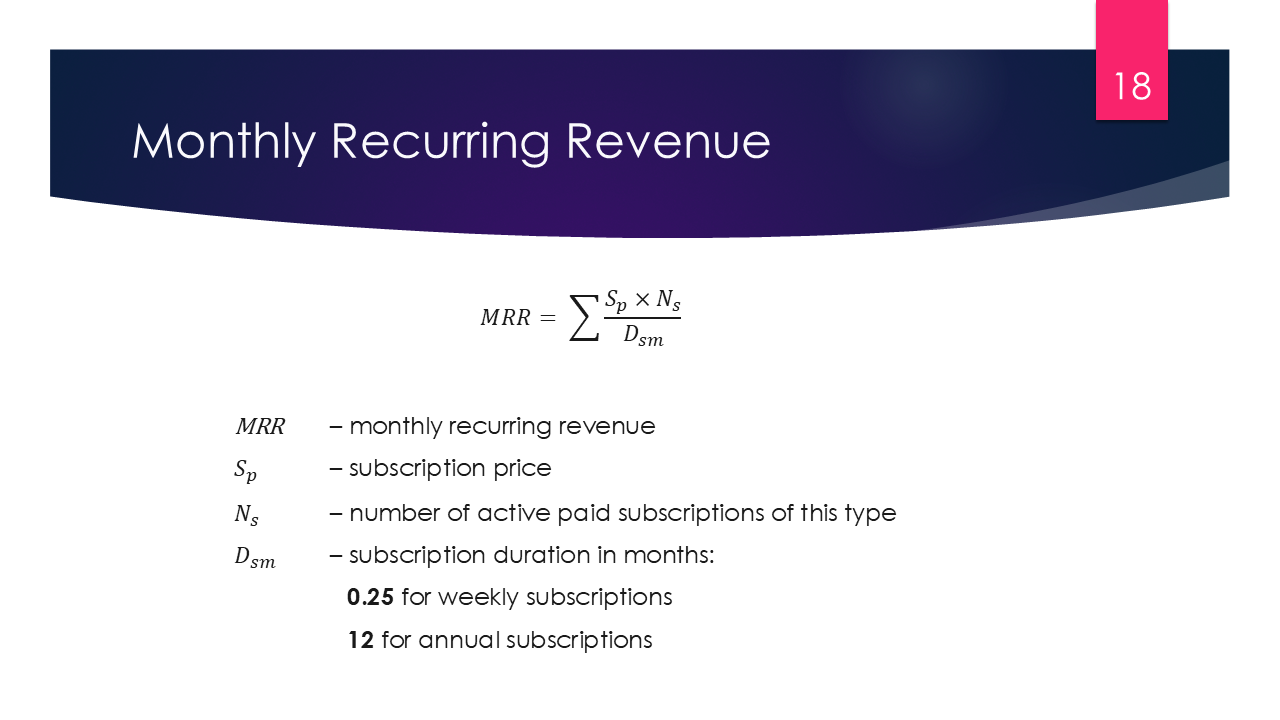
MRR (Monthly Recurring Revenue)
MRR shows predicted revenue from all active subscriptions normalized to one month. This metric works mostly for recurring subscriptions with different recurrence period.
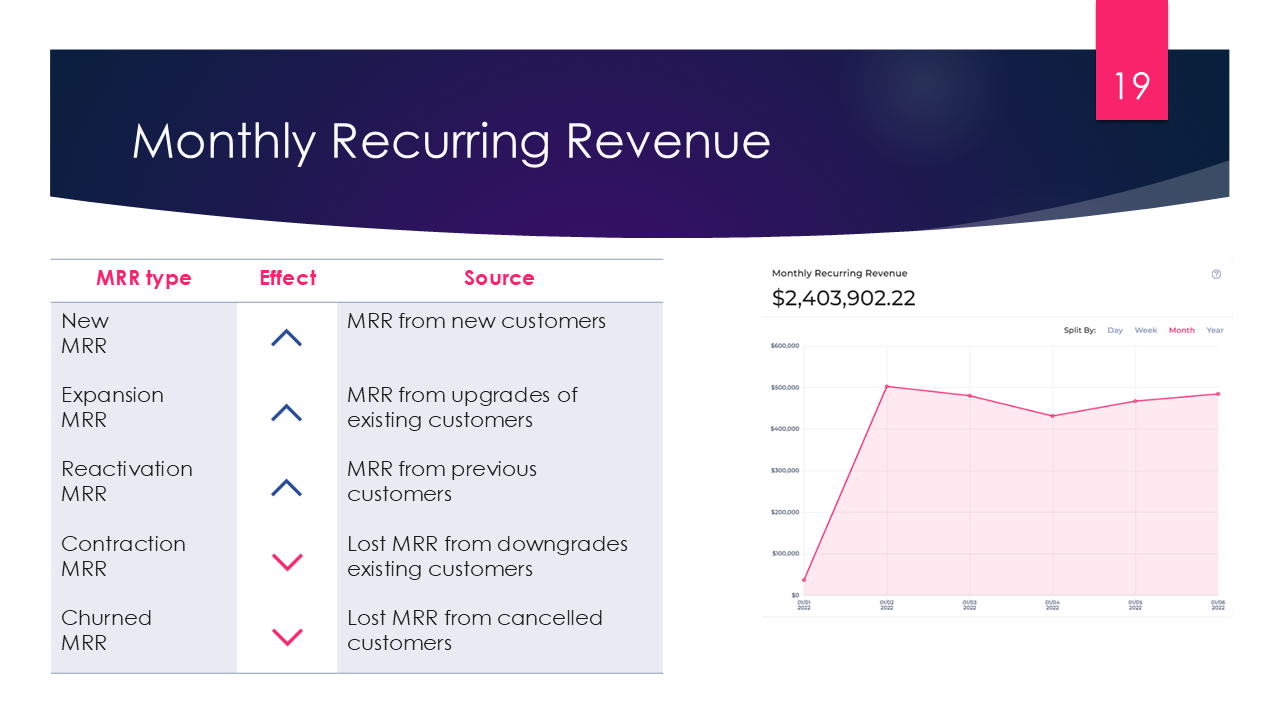
While on the surface MRR is a very straightforward metric, it can be extended for more deep analysis. MRR can be separated into five types:
- New MRR – MRR from new customers
- Expansion MRR- MRR from existing customers which made upgrades
- Reactivation MRR – MRR from previous customers, who canceled their subscription but returned back
- Contraction MRR – Lost MRR from existing customers who decided to go for cheaper subscription
- Churned MRR – Lost MRR from canceled customers
Basic MRR is the sum of first three ones minus last two ones.
LTV (Lifetime Value)
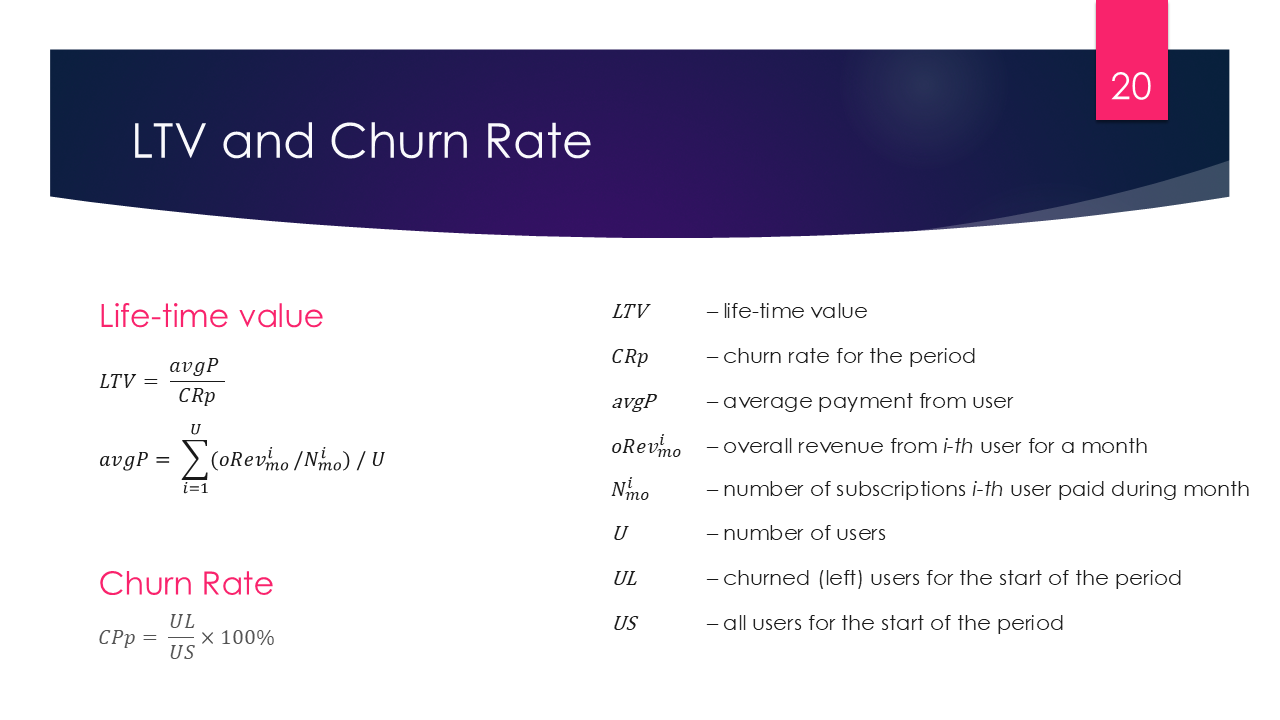
While we’re speaking about expectations and predictions on this stage it is possible to roughly calculate so called LTV (life-time value) of a customer. This parameter measures how valuable average user is for app owner. For example, if LTV is 100$ app owner may consider spending even 90$ on attracting a mew user and he still most likely will get profit. To calculate LTV it’s basically needed to divide average payment per user per month to churn rate for the period being analyzed.
This parameter includes not only positive effect of successful subscriptions, but also a so-called churn rate.
Churned users are those who left the app – canceled trial, turned off autorenewal or requested refund. In some cases here may be included non-active users, which didn’t show up in the app for some period of time (usually more than a month).
Churn rate depicts a part of users, who left the app, in the total amount of users, including users on trial, subscribed or those who never subscribed at all yet.
Tracking the User Journey
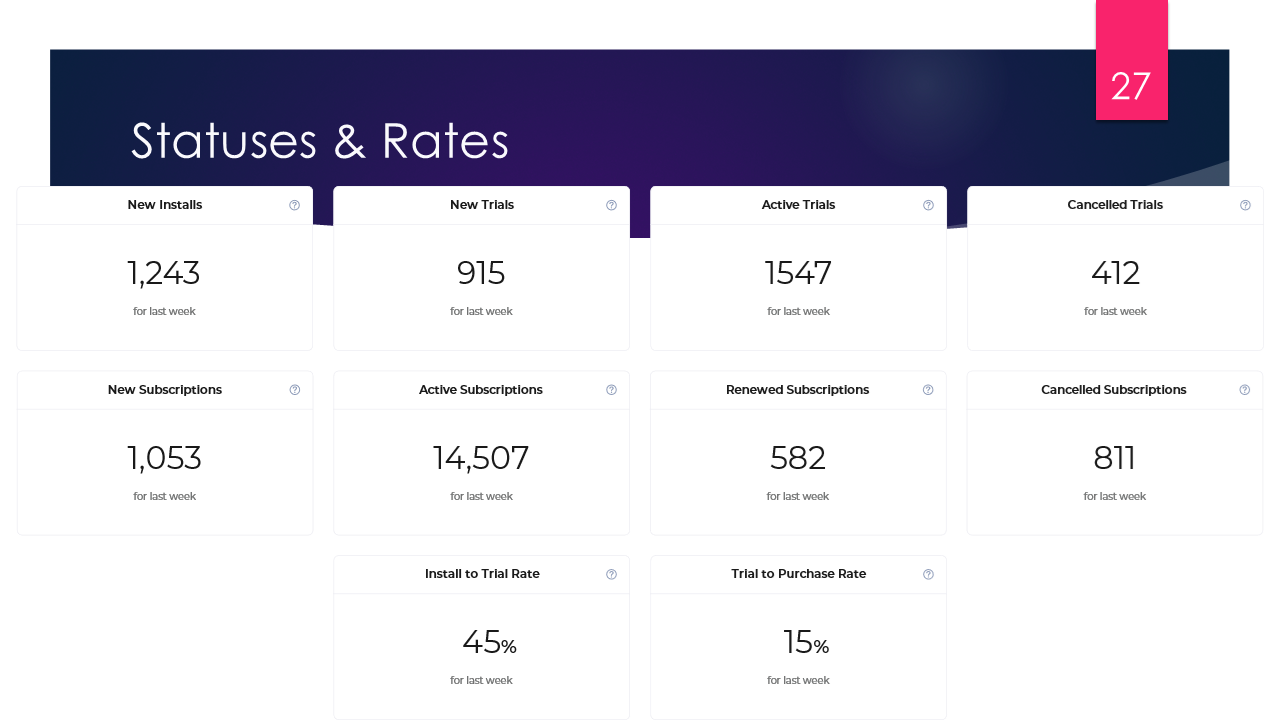
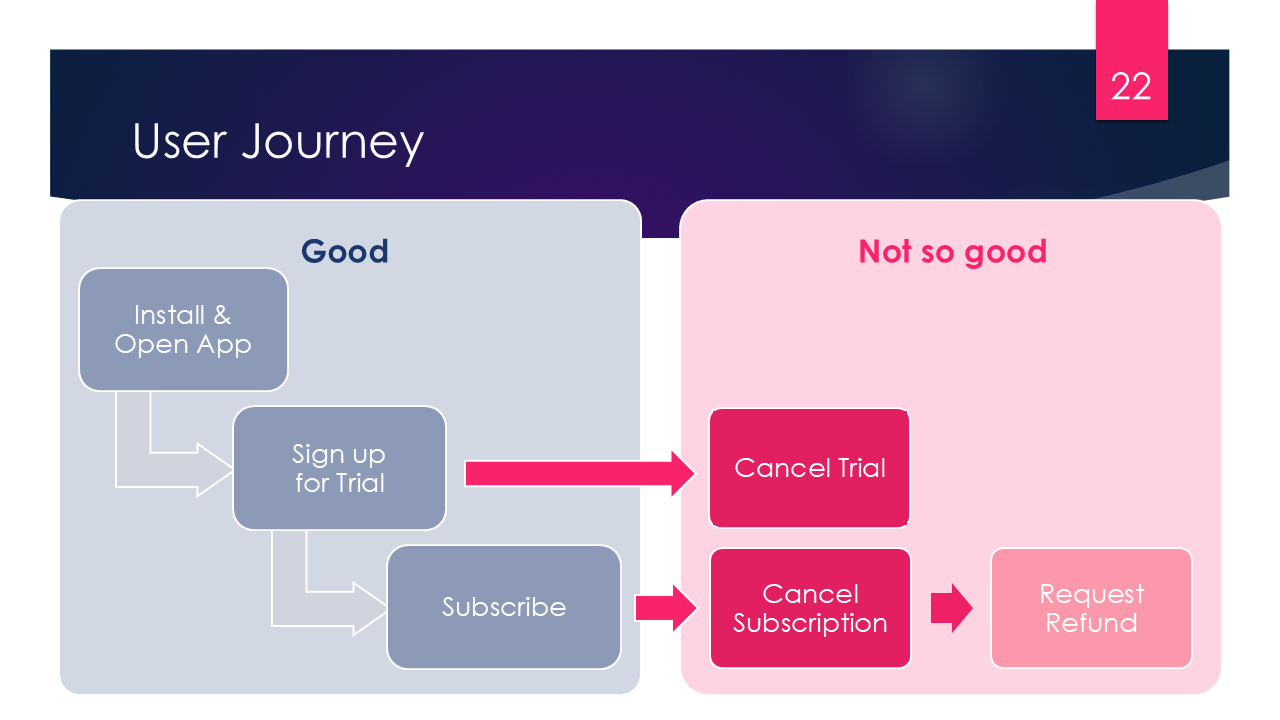
There are some steps user should fulfill before brining app owner his money. First of all, he needs to install an app. Unfortunately there is no reliable way to know that user installed the app until he opens it for the 1st time, maybe just download statistics in Play Market or App Store. Even if user installed and opened app, he’s obviously not engaged anyhow yet. When we speak about subscriptions (not one-time purchases) there is a commonly used practice of providing trial access, which is like a short-term free use of the feature available by subscription.
And when user successfully subscribed it doesn’t mean he will use this app forever. People can subscribe, or cancel subscription, or reactivate it after they’ve cancelled it and didn’t pay for some period of time.
Tracking Negative Events
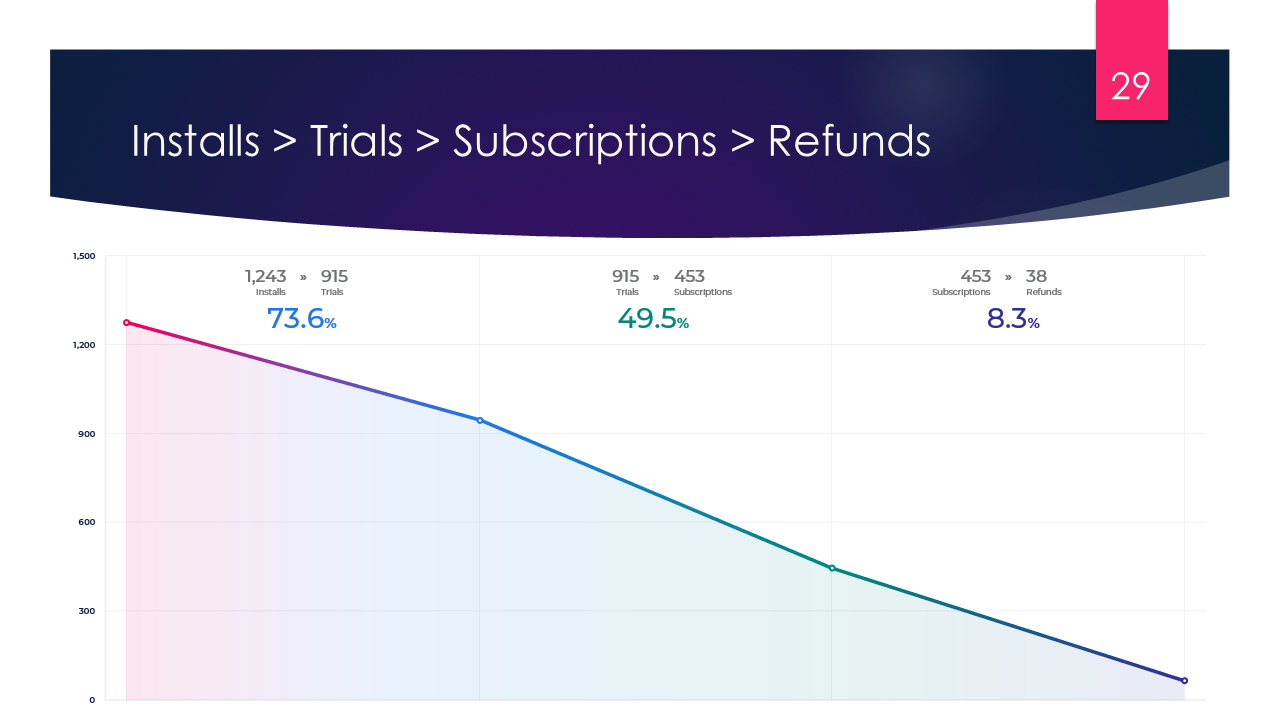
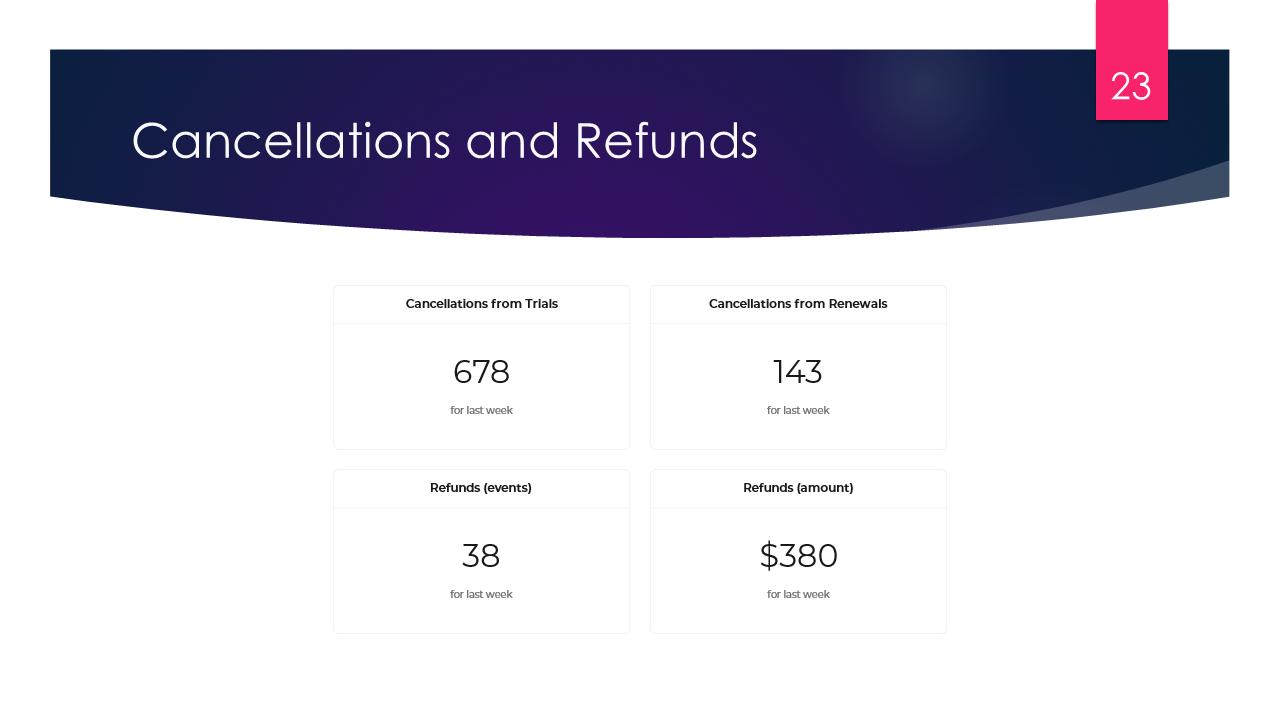
There are negative events that are definitely worth to be tracked – they are cancellations and refunds. Cancellations can be done from trial, when user didn’t pay anything yet and doesn’t want to, and from Renewals, when user was subscribed for some time and doesn’t want to continue. Refund is an event when user cancels his purchase and claims for moneyback, which obviously deducts this amount from revenue and is the worth scenario for app owner.
Cancellation Reasons
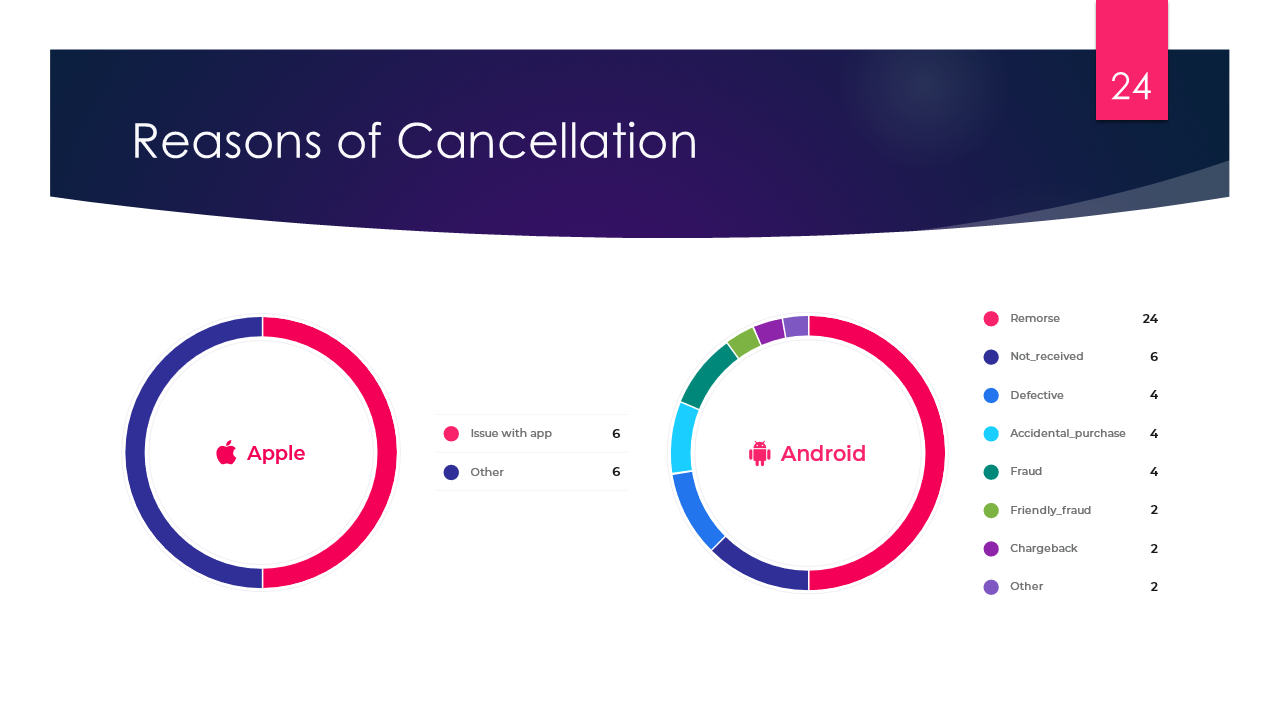
Both Google and Apple provide developer ability to track events related to subscriptions and money transactions, so with notification about cancellation developer optionally gets a field called reasons of cancellation. Android is more precise here giving more options to understand what went wrong.
Conversions
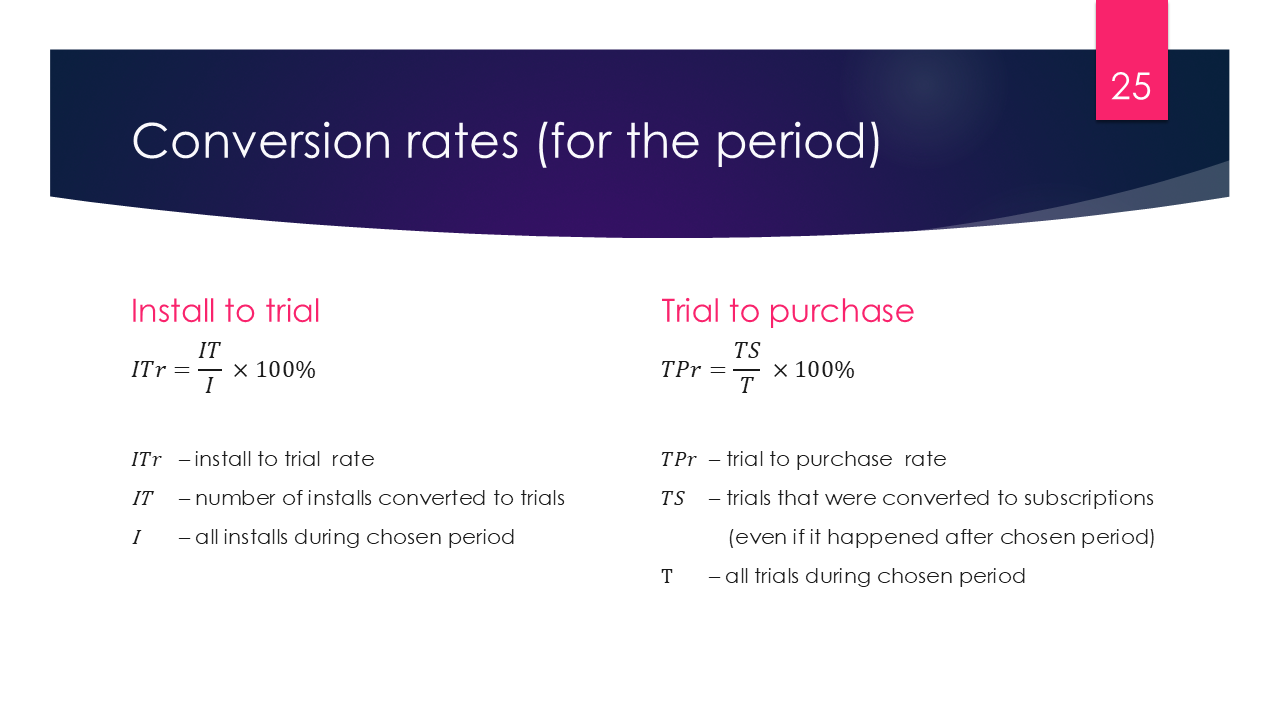
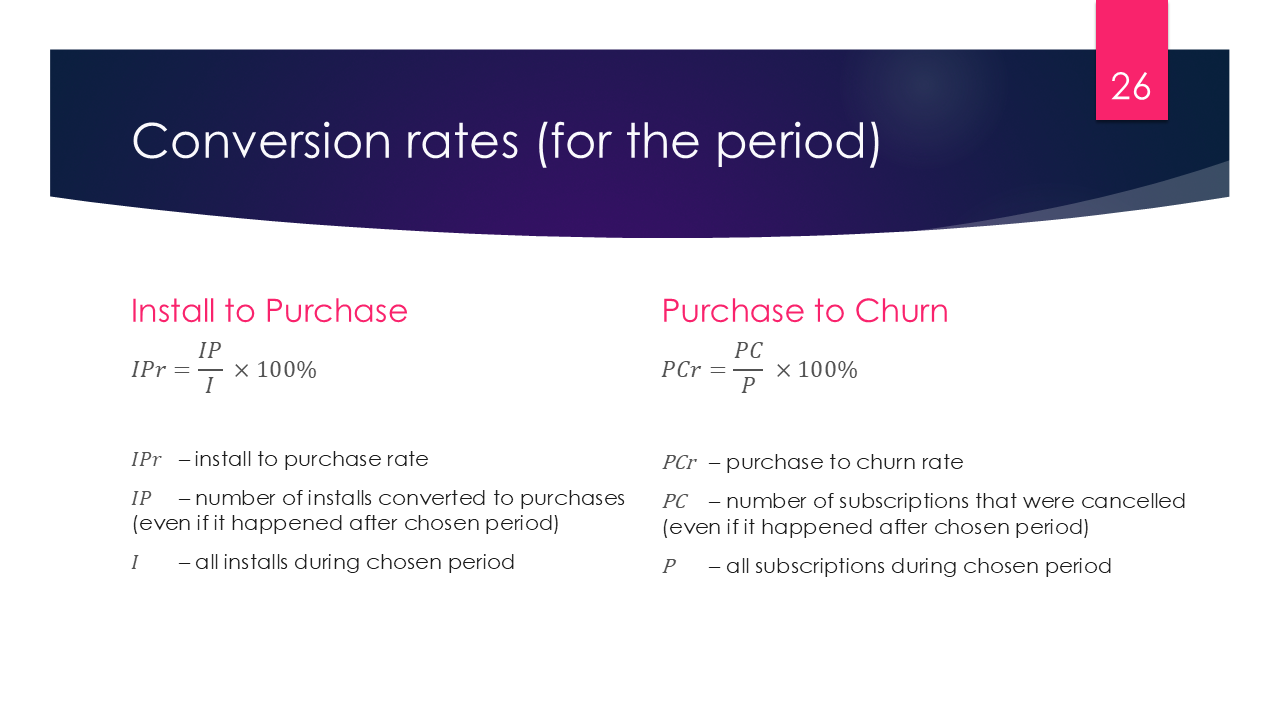
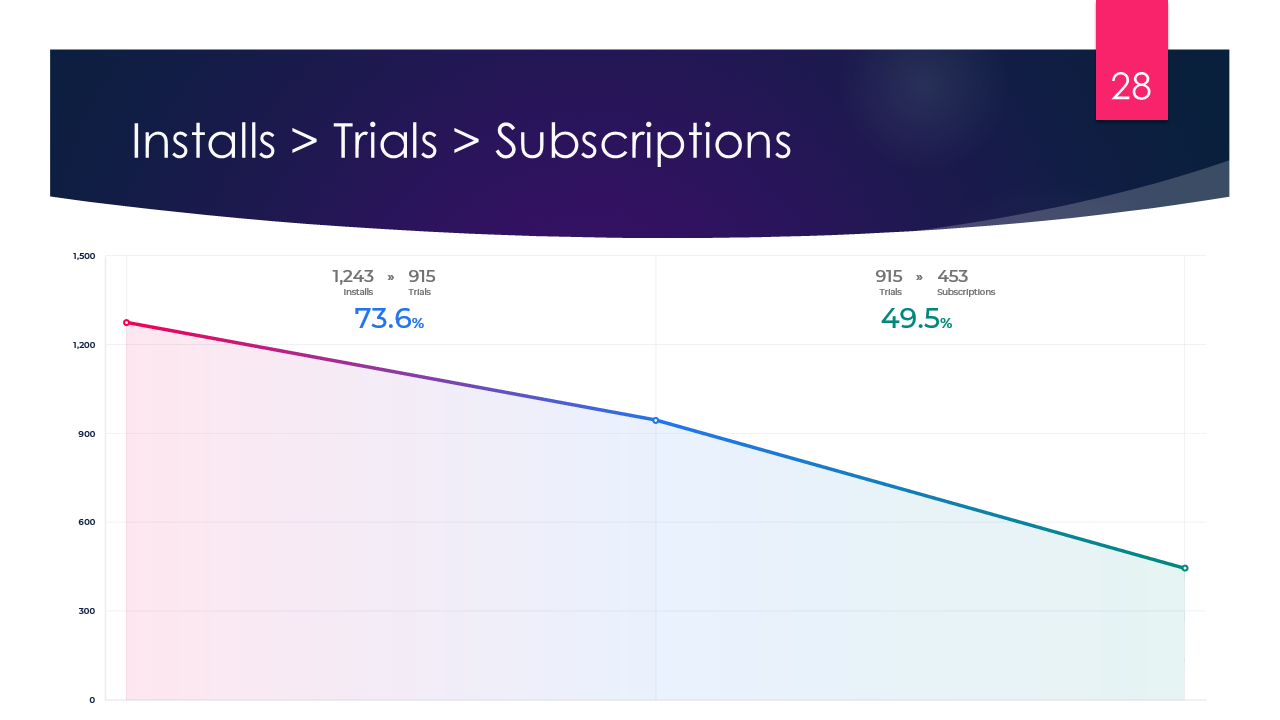
The journey includes conversion from installs to trials, and from trials to purchases (or subscriptions if we speak about recurring payments). It’s good to track conversion rates on each step of user’s journey do discover bottlenecks or weak places of the app.
Also there may be conversion from installs directly to purchases if app doesn’t provide any trial. And the nightmare of every app owner conversion from purchase to churn.
The main aim of every app owner is to convert installs to trials and trials to purchases and avoid going from purchases to cancellations.
Having all this data by hand it’s possible to visualize the users journey through the subscription process.
Visualizing Behavior
Funnels, line charts, and cohort analyses reveal patterns in installs, purchases, and churn.
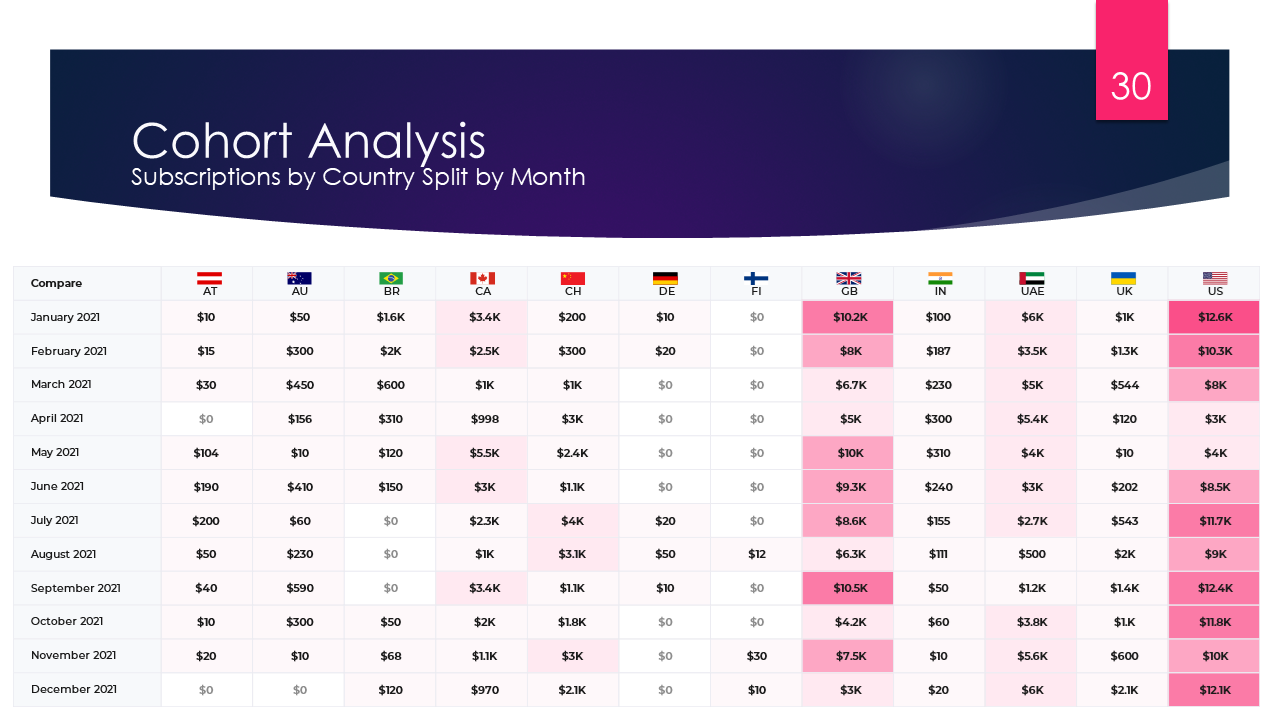
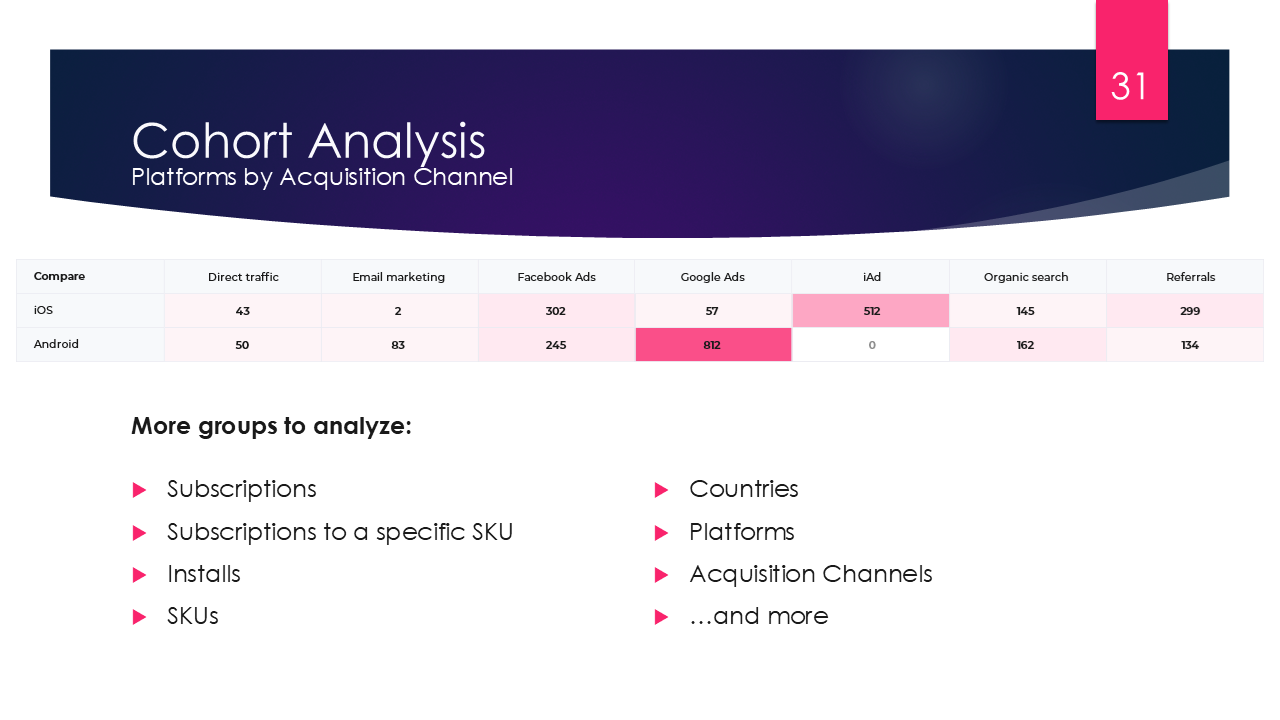
Cohort analysis is a really good way to present the data and get useful information from it. The word “cohort” itself refers to a specific group of people who all share the same characteristics. In this area cohort analysis refers to the user behavior analytics in specific groups. It’s quite flexible tool that allows to split all existing data into some groups and analyze them in relation to some parameter.
For example you can see statistics for each month subscriptions analyzed by country. If the resulting parameter is Revenue, you basically will see in which month each country brought you more revenue.
Cohort sometimes is called a heatmap, because usually cells are filled with color which intensity or depth depend on the value – the bigger the value is compared to other cells, the brighter is the color.
You can do cohort analysis not only by countries but by Platforms to see which platform users subscribed more. Or for example by Acquisition channels to see which advertising or marketing campaign brought its results.
It’s even possible to build custom dimension, and not time-based cohorts where initial groups may be subscriptions, Installs, Countries, Platforms or even separate SKUs.
Unfortunately not always the results are obvious and analysist must take a deep dive into the analytical data beyond this table to understand what caused successes or failures in particular groups.
Experimentation and A/B Testing
But why does developer or app owner need all this data and nice charts? Of course it’s good to monitor progress, success and failures. But what’s more important, having this data it’s possible to try to affect future results, for example reduce price if new installs are not converted to purchases, or fix bugs and add more features, if user cancels trial before going into payment plan.

A/B Testing
One of the commonly used types of experiments is A/B Testing.
A/B testing, often referred to as a bucket or split testing, includes comparing two options and later analyzing their outcomes. In mobile applications development, it is primarily used for conversion rate optimization.
A/B testing may help with optimizing the in-application engagements and better understanding of the user’s behavior. In may help observe the impact of the new features And of course lets app owner to rely on the data-driven conclusions eliminating the guesswork.
Conducting A/B test developers can see how modifications to the application’s features, subscription prices, or even UI and UX design can impact the various metrics, including session time, LTV, and conversion rates.
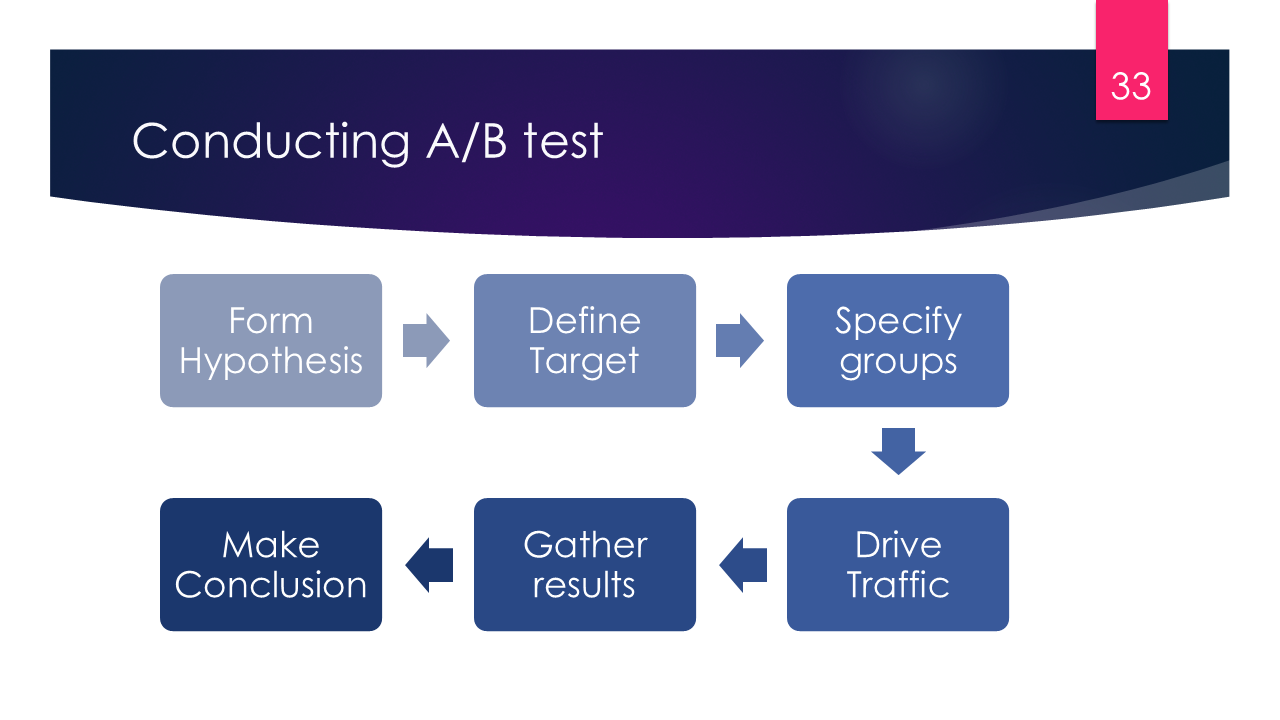
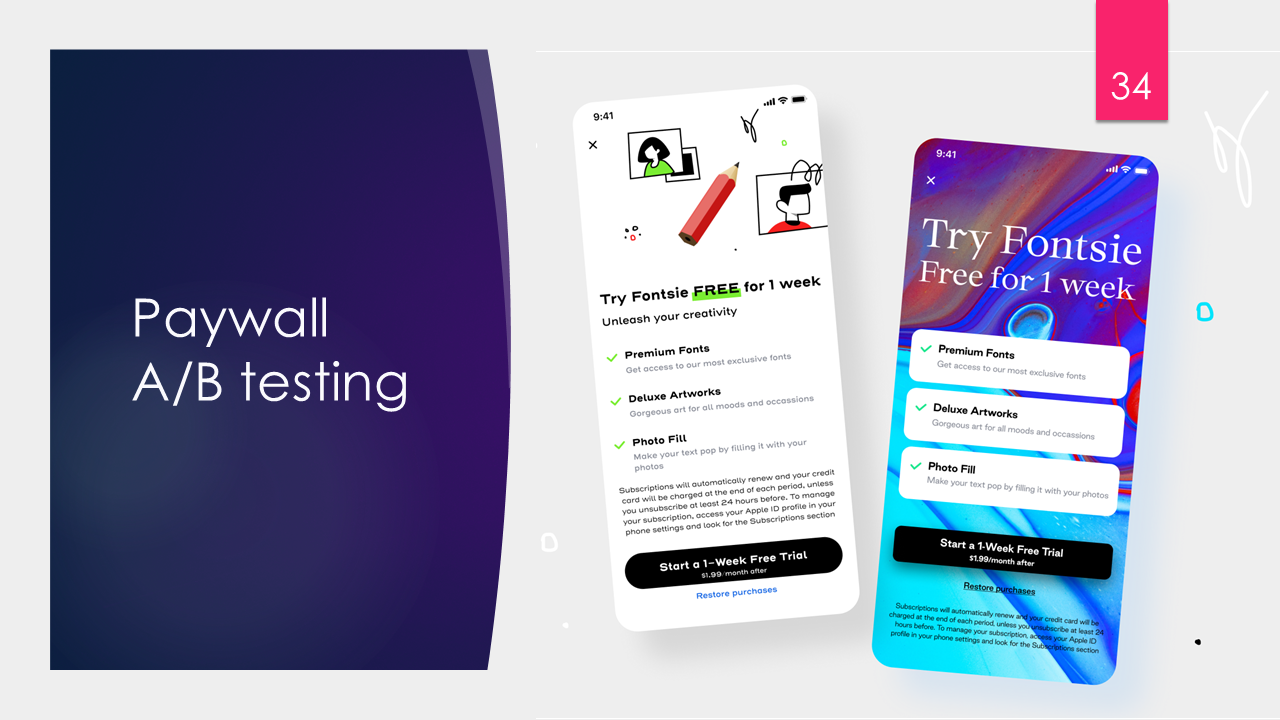
Every test starts with hypothesis formation and defining target instance (set of SKUs that are being tested). Once the objective is identified, developer should drive users towards the page with this target. For in-app purchases such page is called a Paywall, you saw some examples at the beginning of the lecture. Paywall is an app screen with “Subscribe” or “Purchase” button.
However if A/B test is launched users are randomly distributed between several variations of the paywall.
If the analysis results are positive, developer can confidently pitch a larger audience to the modified paywall.
A/B Test: An Example
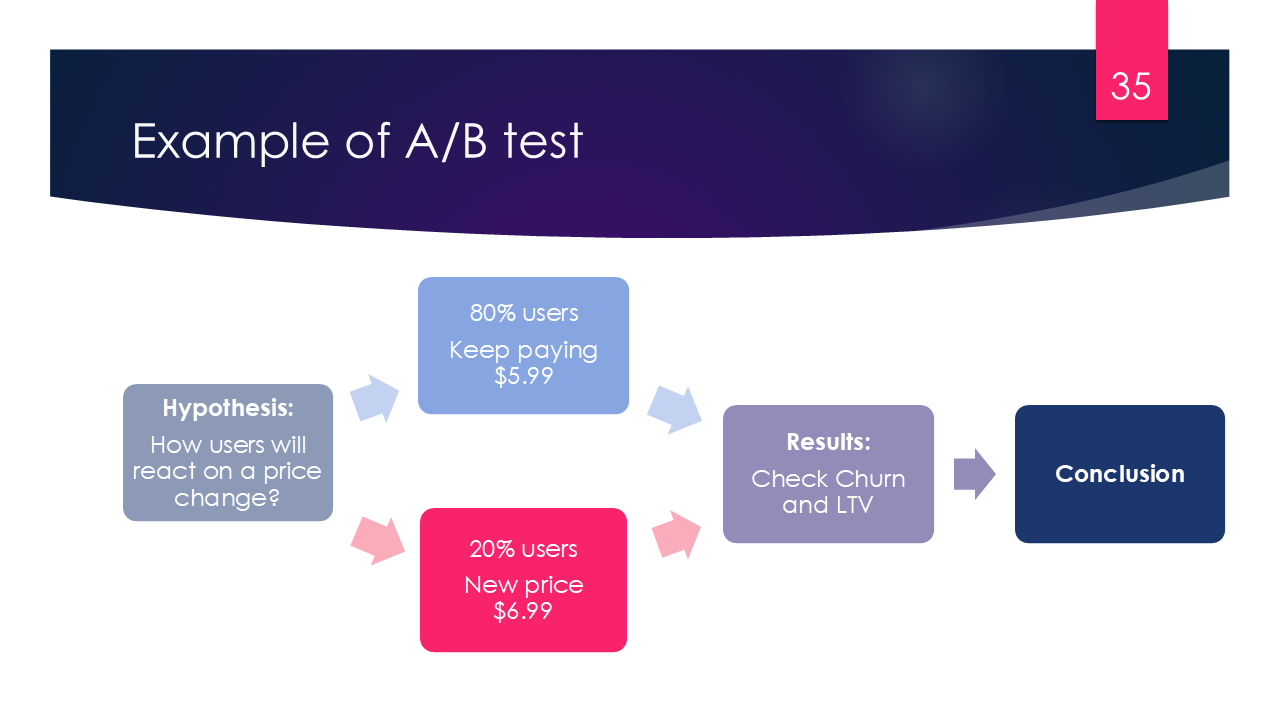
For example app owner wants to increase subscription price from $5.99 to $6.99 per week but doesn’t know how users will react on this. He may set up A/B test, when most part of the users will still pay $5.99 and selected 10 or 20% will be shown a new price.
After few weeks he should measure LTV for average user of both groups, and also check the churn rates separately. If the cancellation rate in group B didn’t grow too much while LTV has grown, app owner can increase the price for more users. As the traffic is split randomly, we may assume that results are quite representative for all audience.
Advanced A/B Testing on Segments
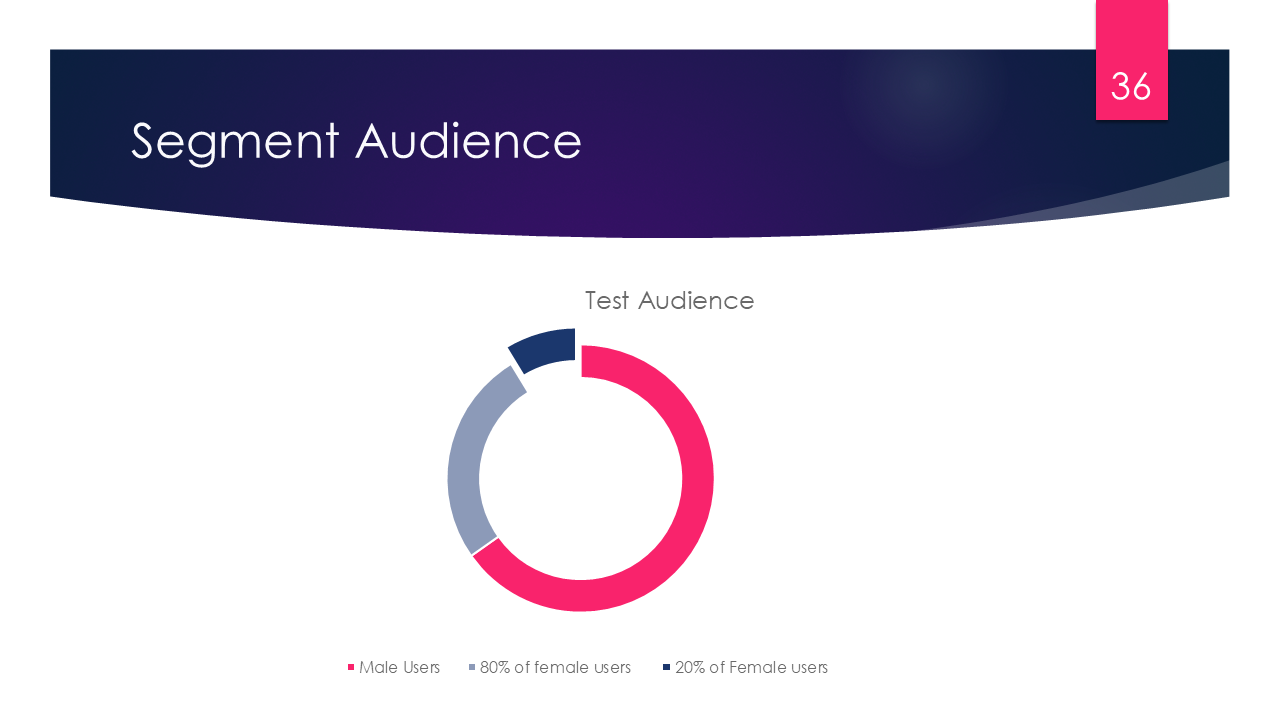
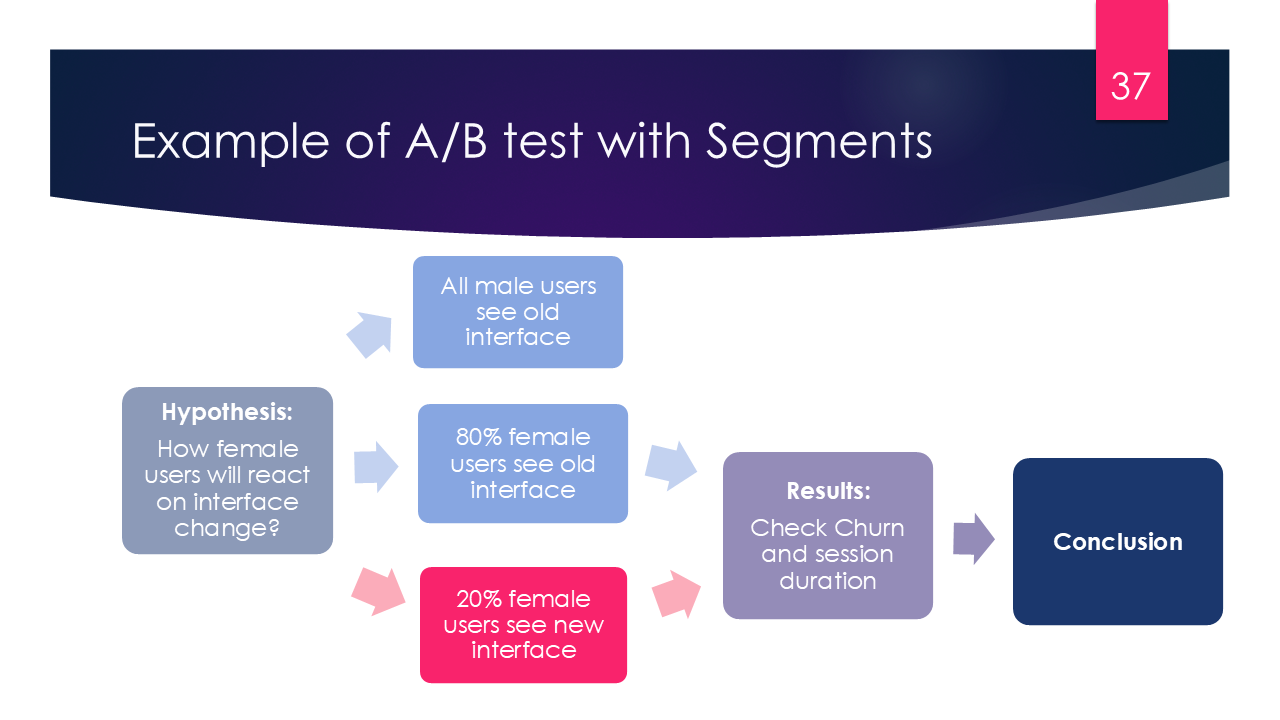
At the very beginning of this article I mentioned information we can know about our users. It was of course collected non just for fun and here is a good place to use it. Advanced A/B testing can be performed not only on all bunch of users, but also on so-called segments.
Segment is a group of users which have some common parameter. of your entire set of users, one segment might be users from a particular country or city, or those which speak one language (strictly speaking we actually don’t know which language they speak but we know locale and interface language of their device). Another segment might be users who purchased a particular SKU. If custom parameters are gathered, we may know user’s gender and age and make segment of women below 30 for example.
It will have to target A/B tests not to whole users but to part that may be sufficient for the app.
Colorists detected that Blue is the most popular color for both men and women. The most unpopular color for men is brown. The most unpopular color for women is orange. With segments it is possible prove this theory by changing the design and checking how users interact with it.
Prediction Systems: Acting Before It’s Too Late
Experiments themselves may bring profit or become a failure, but app owner if only he isn’t monitoring his data twenty four to seven, may miss some signs of successful experiment, if they were not obvious enough, or may not notice signs of failure if something went wrong.
And it’s a perfect area for creating some prediction system. It’s good to have an advisor who keeps an eye on all data at a time and can discover patterns and dependencies in it.
Unfortunately there is no real fully functional Artificial Intelligence system which would learn on mobile data, though I heard some big players of this market are working on it. But even you can come up with the rules that may help app owner to improve his app performance.
Tracking Negative Cases
These can be simple rules like:
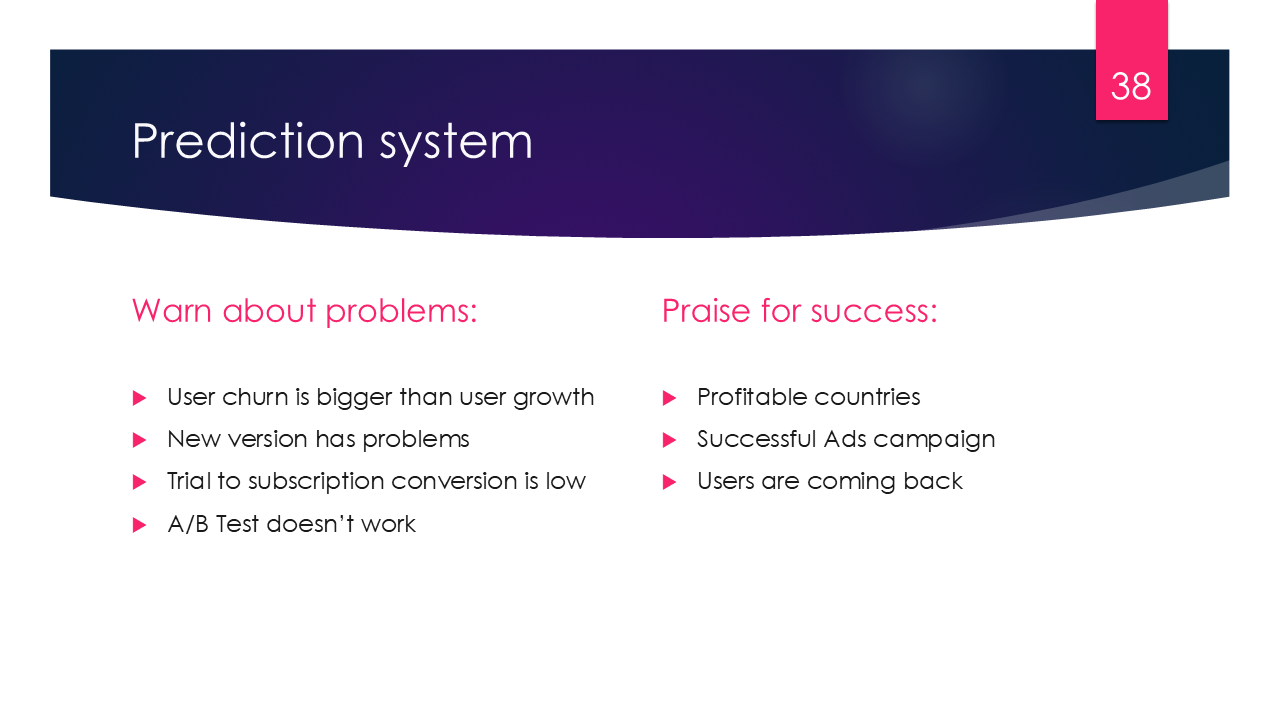
Warning: Users churn is bigger than users growth. How to discover it? check the last 30 days churn and growth. If churn is bigger, notify app owner that he’s losing users.
New version has problems . It’s quite easy to track date and time when new app version appeared in the market and was delivered to users’ phones via autoupdates. If at this point Churn rate goes up then most likely users didn’t like the update or it contains bugs.
Conversion from trial to subscription is low. If conversion from trial to subscription is lower than some threshold (for example 20%) during the last 30 days, but cancelled users still use the app (open it regularly), it may mean that there is no big difference between free and paid versions, or feature suggestion in paid plan is not so good as expected. In this case it is possible to recommend user to improve paid features or add more premium content to gain more interest in paid plan.
A/B Test doesn’t work. If user is performing A/B test with two or more SKUs and one of test groups didn’t make any single purchase it’s good to warn user before his test ends, for example in the middle of the test period.
Tracking Positive Cases
Of course it’s good to cheer up user if his app is doing good:
Most profitable country. Check what country was most profitable for the last 30 days and compare it with the 2nd country by profitability. If this difference is more than some threshold (for example 20%) it’s worth pointing user’s attention to country number 1 and suggest to invest in targeted ads. And if the difference is less, maybe it’s worth to check country number two.
Successful ad campaign. If during last 3 days a number of installs has grown, and most of the users have the same acquisition source, it’s good to tell user that his marketing efforts in this source were effective.
Users are coming back . If reactivations for the last 30 days are at least 10% more than reactivations for the previous 30 days – it means developers brought up new features or more premium content which interests users.
Thresholds
Of course the main problem here is to determine thresholds – days, presents which should trigger a warning. This is a perfect ground for building a machine learning system which will tune these parameters to give more precise recommendations.
The Tools of the Trade
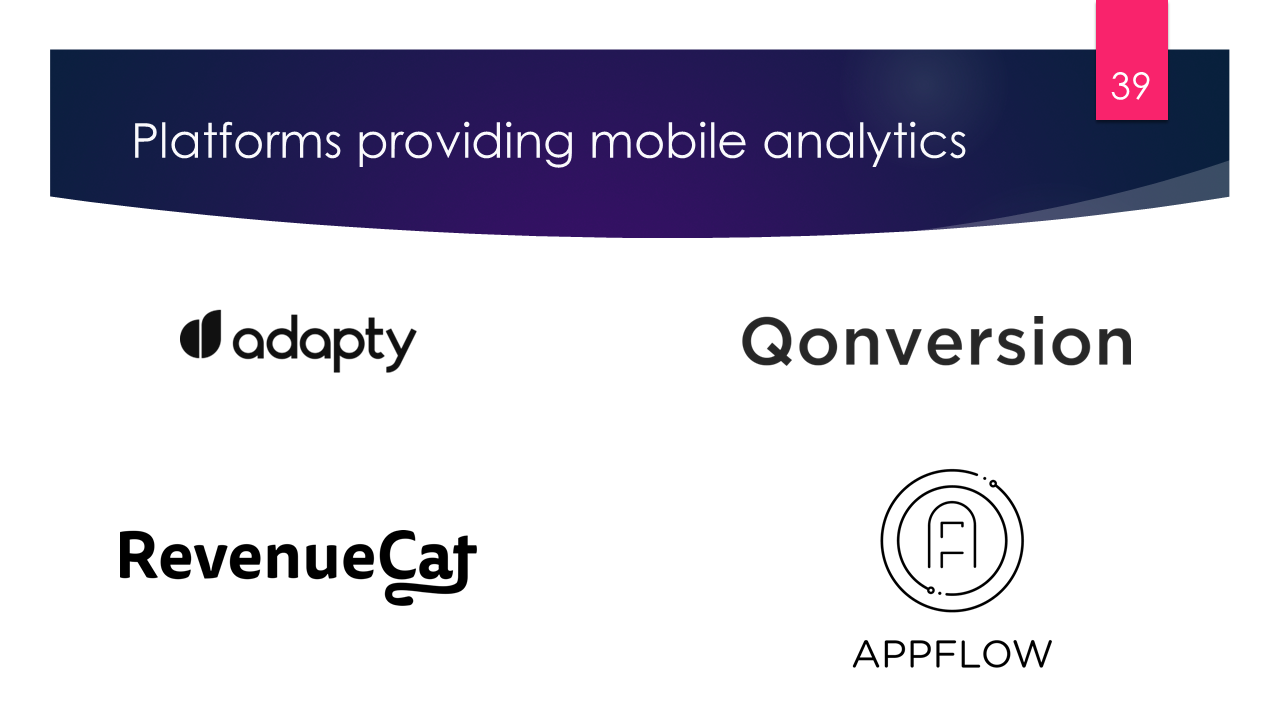
The mobile analytics ecosystem includes major platforms that provide dashboards, APIs, and SDKs for deep integration. Choosing the right one depends on your data needs, resources, and technical stack.
Conclusion
In-app purchase analytics is far more than sales reporting — it’s the backbone of strategic decisions in mobile product management. From understanding user behavior to forecasting revenue and testing product changes, it turns raw transaction logs into a clear growth map.
If you’re building or running an app, your data already tells a story. The question is: are you listening?
This lesture was first presented 05/07/2022 on Dortmund IRC and Summer School 2022 event in Fachhochschule Dortmund
